Melbourne housing land supply is tightening across key growth corridors, constraints in suburban activity centres and the need to absorb ~2.4 million extra residents by 2051. This briefing distils where capacity exists, which planning levers matter (HCTZ, LDRZ) and how overspill into peri‑urban/regional areas can support potential housing outcomes. Demographic Solutions recently partnered with Spatial Economics to provide information for a Melbourne utilities authority. While many companies will look to the next five or ten years in terms of their outlook strategy, many government functions have a much longer timeframe. This is a huge challenge for population forecasters, given that there is an enormous leap of…
It is fairly well known that over the past decades, home ownership rates have fallen, while the proportion of Australians renting has increased. This shift has also seen changes in the dwelling stock composition of Australia, with an ever-increasing share of households living in apartments and medium density dwellings as apartments are relatively more affordable and often in more desirable locations.Today, we wanted to dive deeper into the data to reveal the factors affecting rental rates across the country. Those familiar with the metropolitan areas of Australia are likely aware of the impact of the property investment industry, rising living costs and the need for…
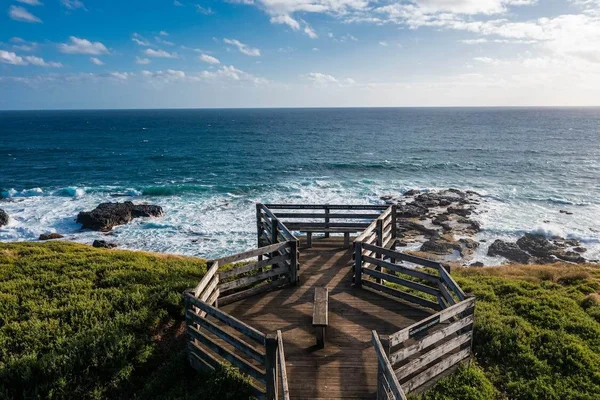
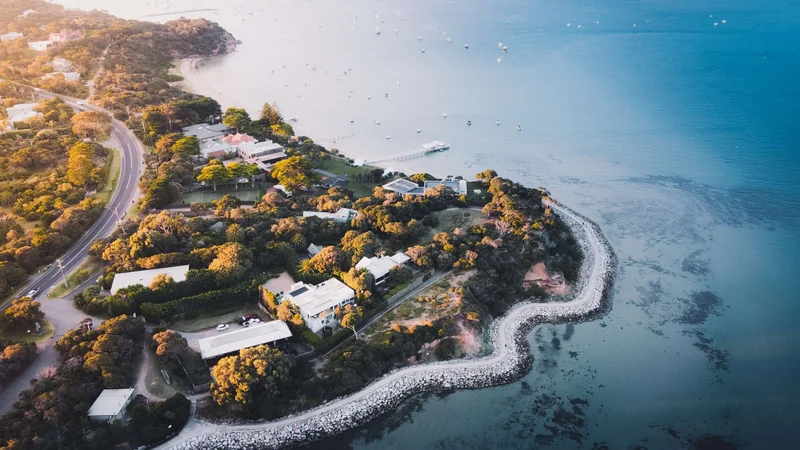
Victoria has witnessed significant migration from Melbourne to regional towns during the last decade. The desire for a simpler, more affordable, and less stressful life allowed many Melburnians to pack their bags and ‘seek refuge’ in regional areas and coastal towns, altering the socioeconomic landscape and reshaping communities. With the power of retrospect, we take a look at the patterns of migration, the motivations behind them, and ask whether this trend is temporary or here to stay. A changing market and pandemic spurred shift This demographic shift was most prominent during the last inter-Censal period (2016-2021) and accelerated during the COVID-19 pandemic. The “Great Resignation”…

The result of the 2023 Referendum on Indigenous Recognition and the Voice to Parliament was a disappointing outcome for the ‘Yes’ campaign and I feel that disappointment too.While the overall result seemed never to be in doubt, the pattern of voting across Australia is highly revealing about the nature of people’s views about progressive social issues. It may also reflect the inherent conservative nature of the Australian electorate when it comes to change and the level of priority that Australians have towards the nation’s first peoples.The blurring of traditionally labour areas into the ‘No’ camp and liberal areas into the ‘Yes’ camp is obvious from…
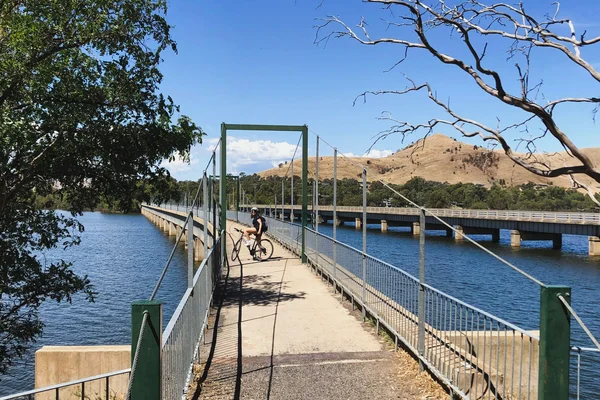
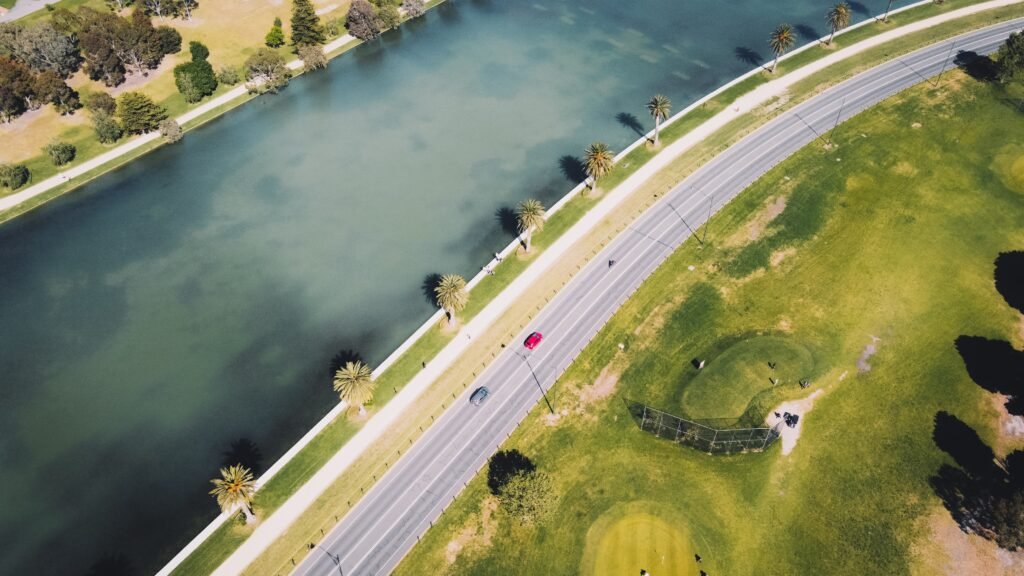
A cycling jaunt One of my pastimes and outlets is cycling along rail trails. They are peaceful and you get a chance to see some amazing Australian countryside.I recently rode to Mansfield in Victoria along what is called ‘The Great Victorian Rail Trail’. There is some spectacular scenery and impressive engineering feats, the chief amongst them being the bridge across the Eildon Dam at Bonnie Doon (How’s the Serenity!).This trip made me reflect on the demographic changes that have occurred in the region and divergent patterns of population growth in these two centres over time. Understanding regional growth To provide context to the nature of regional growth in…

If you have been keeping with the news, you may have seen the 2023 release of the Intergenerational Report, a document summarising economic outlooks and Australia’s budget over the next 30 years. One of the major challenges identified is Australia’s ageing population, an issue which has sparked significant discussion in the media with concerns that even with superannuation, retirees will still not able to cover living expenses.According to AMP’s 2022 Financial Wellness report, 21% of working Australians are not confident that they have the funds to live at their desired lifestyle in 2022, up from 17% in 2021.While we acknowledge the challenges of the situation…
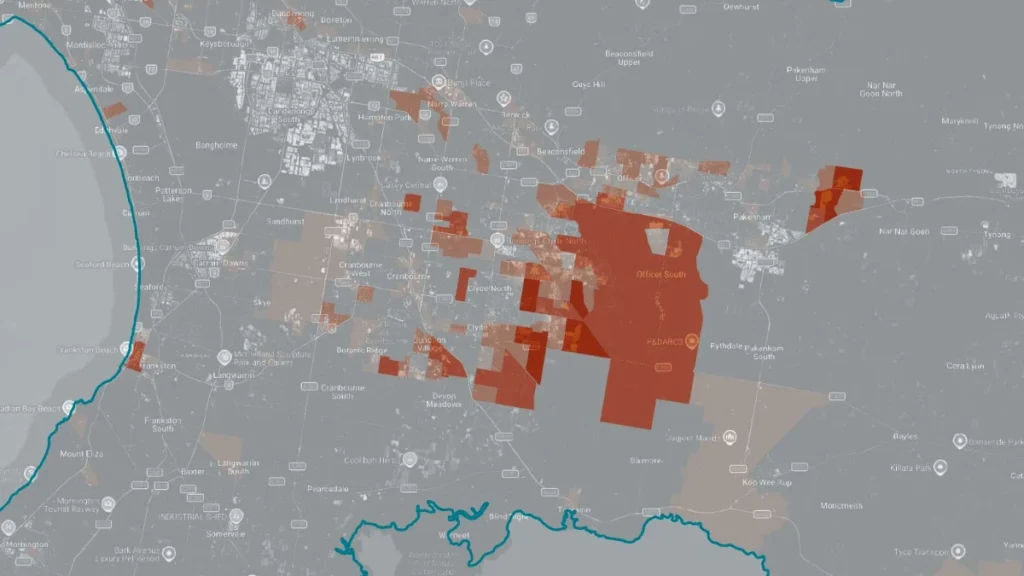
Welcome to the second instalment of our Empty Suburbs series, where we will be taking a look at the suburbs and localities with the highest vacancy rates as of the 2021 Census. For this instalment, we will be exploring Victoria.From our last episode where we covered New South Wales, we found that the highest vacancy rate suburbs are along the Central Coast and the Inner City. Rather than just commenting on the phenomenon of high vacancies, we will also be highlighting the comparison between Victoria and New South Wales and the impacts of COVID-19 on Victoria’s dwellings. Do we see similar trends in Victoria? Are…

With current talks of a housing crisis, there have been discussions around rent freezes, incentives to increase supply of housing or slowing down the intake of overseas migrants. But one factor which is not often discussed is Australia’s use of unoccupied dwellings.So today, we ask the question – where are the unoccupied dwellings and why are they unoccupied? Are they significant in talks around the cost of living?Starting with New South Wales, we will be using 2021 Census data to determine which suburbs have the highest vacancies and examine how this phenomenon changes across localities. But before we jump into the list, let’s first talk…

Many people will be aware that Australia’s population growth has rebounded after the lean COVID-19 years. Unprecedented levels of overseas migration have reversed the minimal population growth from the June Quarter of 2020 to the September Quarter of 2021. The strength of the rebound has come as a bit of a surprise, given the levels of pessimism regarding Australia’s demographic and economic outlook during the peak of the pandemic only two years ago. The increase has been unprecedented with the latest data showing a net migration gain to Australia of almost 387,000 people in the year ending December 2022. This is the highest gain to…

In our previous blog “Population growth in New South Wales: Stories from the 2021 Census”, it was revealed that Camden was the fastest growing Local Government Area (LGA) in NSW, going from 78,200 persons in 2016 to 119,325 by 2021; a rate of 52.6%! The next closest LGAs were The Hills Shire (22.0%) and Blacktown (17.7%). Growth in these LGAs was predominantly driven by rapid rates of greenfield residential development in new estates, hence attracting new residents to the area. “Over half of Camden’s new residents arrive from neighbouring Liverpool and Campbelltown” The migration map below shows the most significant net flows of people to…

Much has been spoken about the changes in development patterns across Australia due to the COVID-19 pandemic. In this article, we analyse dwelling growth in New South Wales and Sydney to discover how development patterns have changed over the last three Census periods. How did we do it? We have allocated all ABS SA2 geographies in Sydney and Regional NSW in 2021 to a series of categories:In Sydney by sector (inner, northern, south-western etc.) and ring (inner, outer etc.)In regional NSW by size of settlement, areas along the coast, areas around Sydney and remaining areasSA2s were allocated for 2016 and 2011 and ABS State Suburbs…
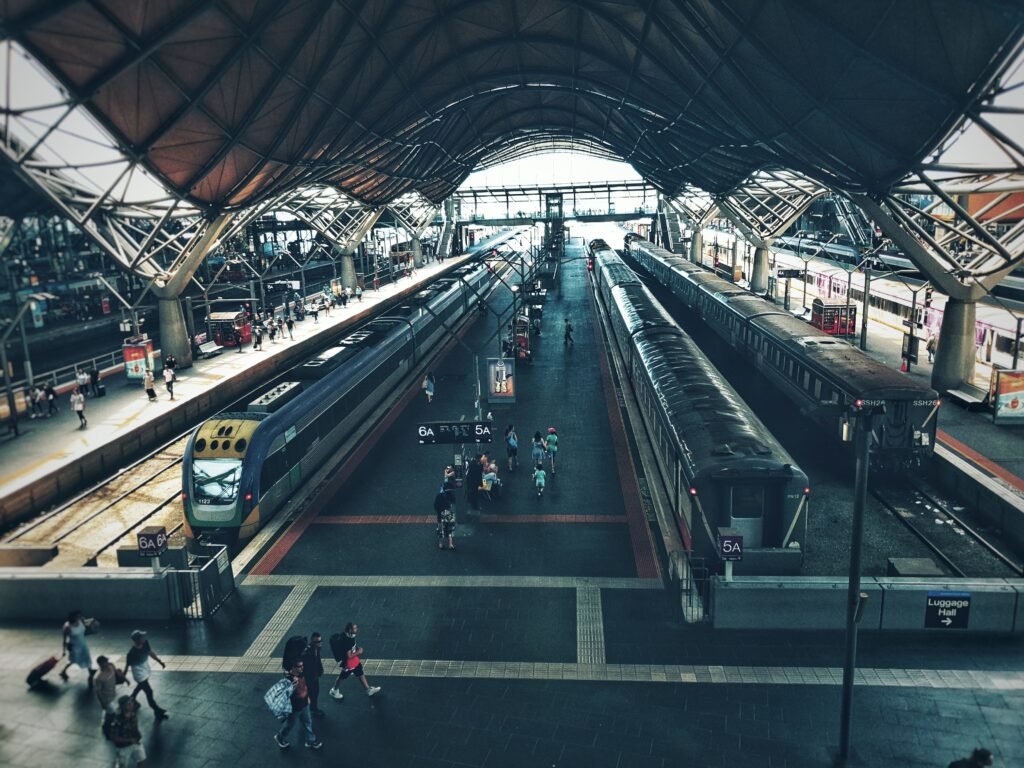
Do you live or work near a PTV train station? Perhaps you drive to one to catch the train? By now, you have probably noticed the amount of residential construction that has taken place around these stations in the last several years – trust us, your eyes do not deceive!Guided by activity centre policies (from both State and local Governments), it aims to focus new residential growth around existing transport nodes, specifically our metropolitan train stations. The idea and practice of encouraging focused higher density development around transit nodes has been around for a while. It brings about many advantages, such as greater walkability, better…
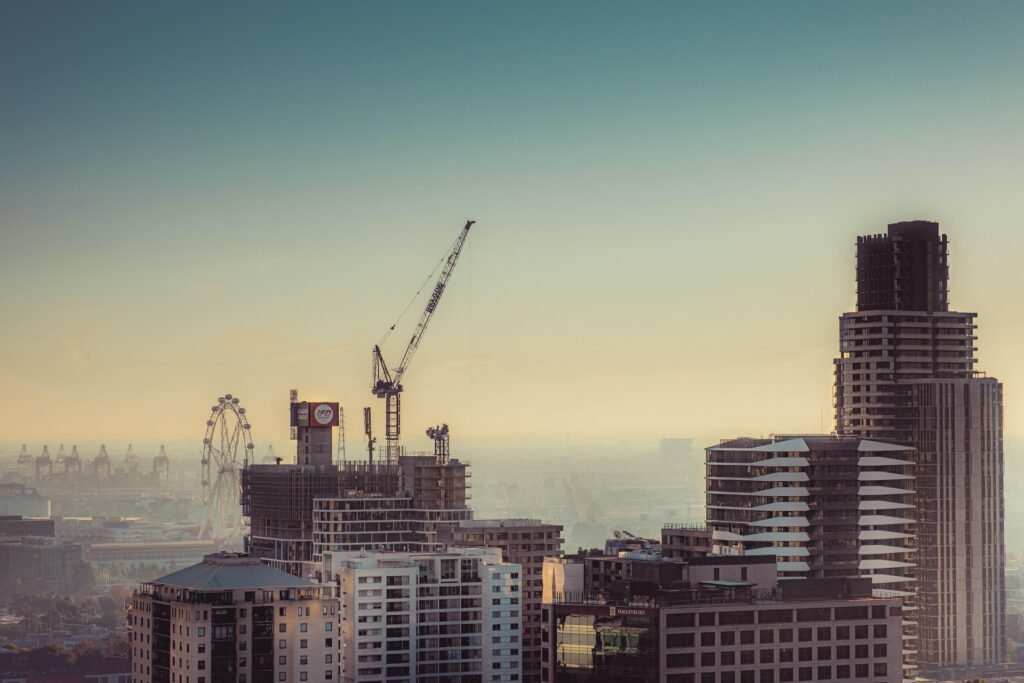
Where has residential development in Melbourne occurred? The beautiful wonderful world of rings and sectors. Much has been spoken about the changes in development patterns across Australia due to the COVID-19 pandemic. In this article, we analyse dwelling growth in Victoria and Melbourne to discover how development patterns have changed over the last three Census periods. How did we do it? We have allocated all ABS SA2 geographies in Melbourne and Regional Victoria in 2021 to a series of categories:In Melbourne by sector (inner, north, west, etc.) and ring (inner, outer, etc.)In regional Victoria by size of settlements, areas along the coast, and other remaining…
The first release of the ABS 2021 Census gave us a fascinating glimpse into to the many structural changes that has taken place within Australia over the last 5 years. Following suit, the second release continued to unravel more interesting trends about the way we’ve adjusted our behaviours and attitudes to the “new normal” in the post COVID-19 and how this is reflected on the wider community and the future of Australia.For those of you who have been following our work (both here and on LinkedIn), you’d know that we have been particularly interested in understanding what the second release reveals about the many employment…
Over 3,000 Melburnians crossed the Yarra River to call Wyndham home The second series release of the ABS 2021 Census has arrived and one of the datasets that we enjoy exploring is the internal migration. This gives us some understanding of the scale of migration and where people are going. If you have been following our Census 2021 blog series so far, we explored the fastest growing Local Government Areas around Australia. In Victoria, this happened to be in the City of Wyndham. During the inter-Censal period, Wyndham went from 217,118 i 2016 to over 292,000 people by 2021 – a gain of nearly 75,000…
The first release of the 2021 Census revealed key insights on the population changes we’ve seen take place within our community since 2016 and the direction in which we’re headed. For the past couple of months, our lead demographers at Demographic Solutions have been extensively covering a variety of topic on our blog page and LinkedIn. With the second release set to be made public on October 12, here’s a quick lowdown on what you need to know before the release. So, what did we learn from the first release? Fringe areas across Australia saw significant gains in population growthA lack of growth in some…
There is constant media attention regarding the state of the housing market in Australia. Are prices going up or are prices going down? Are we meeting housing demand? Are we building too many apartments? Read on to find out more. What Does the 2021 Census Data Tell Us? With the release of the 2021 Census of Population and Housing, we were very keen to see what had happened with indicators of housing supply and demand, namely: Average household size Vacancy rates These two indicators give us a simple, but relatively good feel for the dwelling supply versus demand. At the Australian level, average household size…
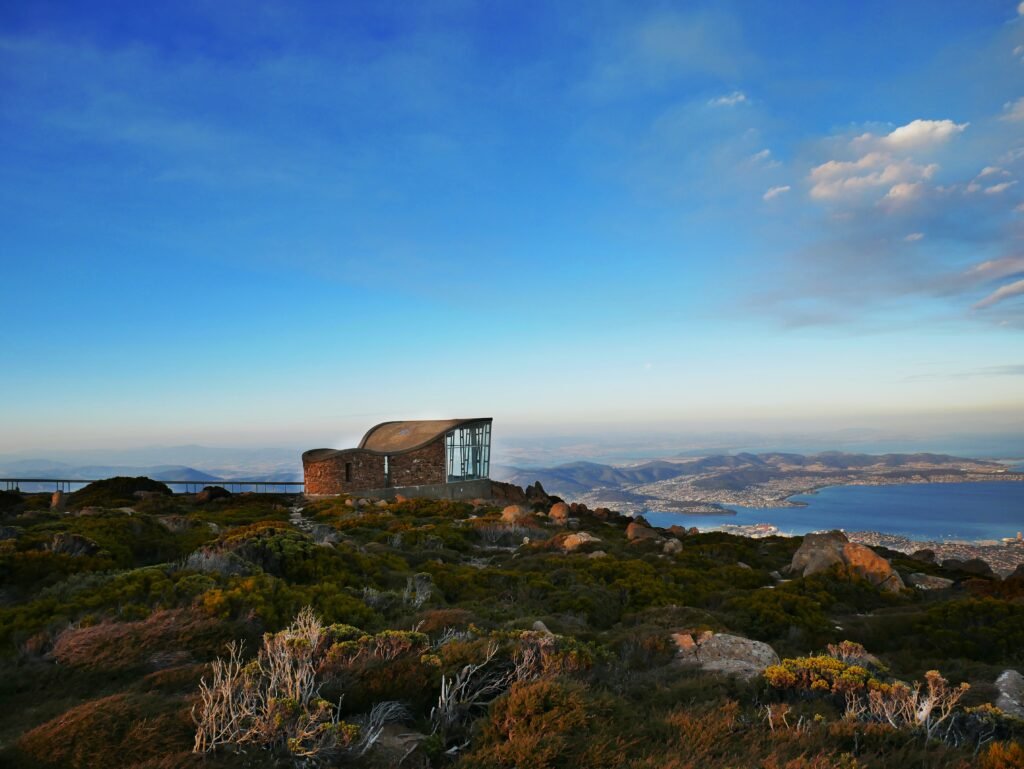
The rate of population growth in Tasmania accelerated rapidly during the 2016-2021 period. The growth rate of 9.3% or 47,610 persons was remarkable after a relatively sluggish previous decade where the State’s population grew by only 33,480. The fastest growing Local Government Areas (LGAs) in Tasmania were a combination of smaller rural LGAs and areas on the edge of Hobart and Launceston. However, the fastest growing LGA in Tasmania between 2016 and 2021 was Central Highlands (17.5%). Almost all LGAs in Tasmania benefited from the large overseas and interstate migration gains to the State that preceded the COVID-19 pandemic. The greatest gains in net terms…
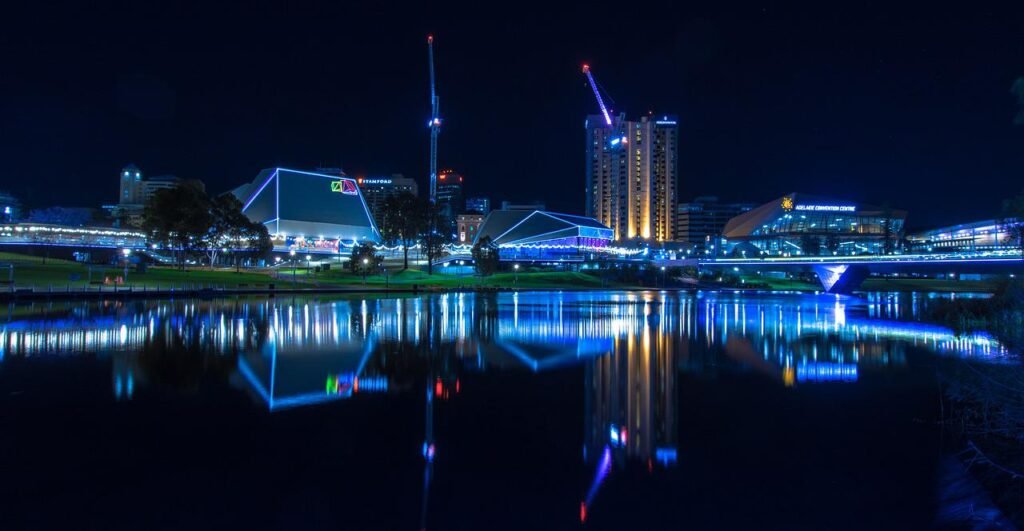
What does the ABS 2021 Census tells us about population growth rates across Southern Australia? Despite the overall rate of population growth in SA experiencing strong gains from 2016 to 2021 (6.3%), not all LGAs across the state benefited from the large overseas migration gain that preceded the COVID-19 pandemic. The fastest growing LGAs between 2016 and 2021 were mainly the outer and fringe areas of Adelaide, where greenfield development was the most predominant. Maralinga Tjarutja Council was the fastest growing Council in remote northern South Australia with a 50%+ increase, although the gain was just 34 persons.Most coastal areas grew strongly in the lead…
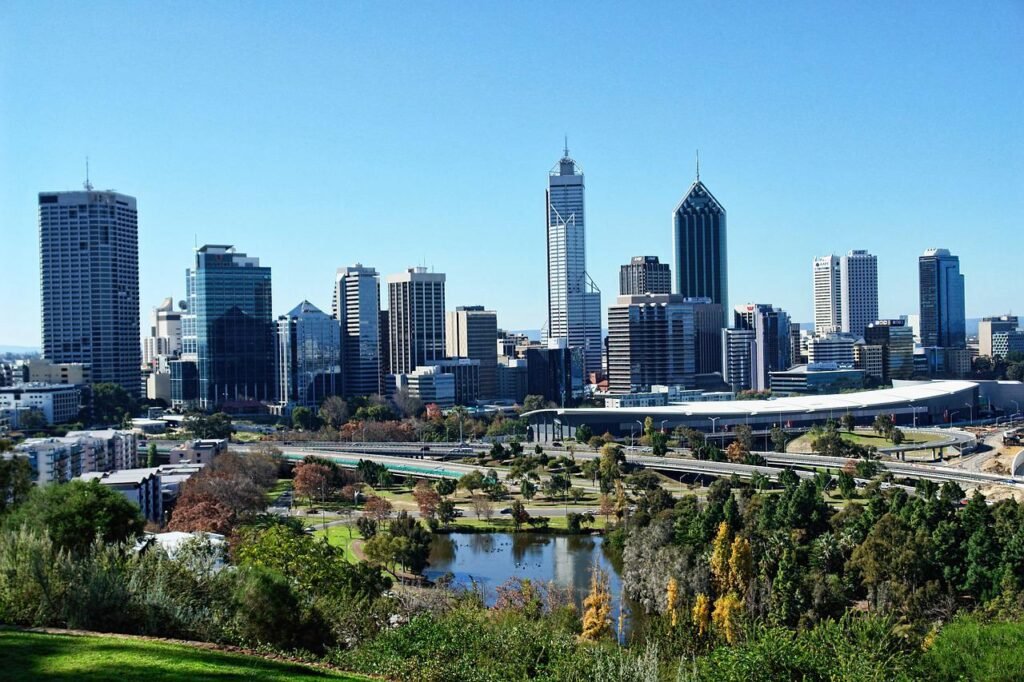
What does the ABS 2021 Census tells us about population growth rates across Western Australia? The overall rate of population growth in WA remained at moderate levels from 2016 to 2021 (7.5%), after a much faster period of growth from 2006 to 2016, based on the mining investment boom. The fastest growing Local Government Areas (LGAs) in Western Australia were a combination of small rural LGAs with increases in population due to mining and greenfield growth areas on the fringe of Perth. The fastest growing LGA in WA between 2016 and 2021 was Mount Magnet (35.5%). Almost all LGAs in Perth and surrounds benefited from…
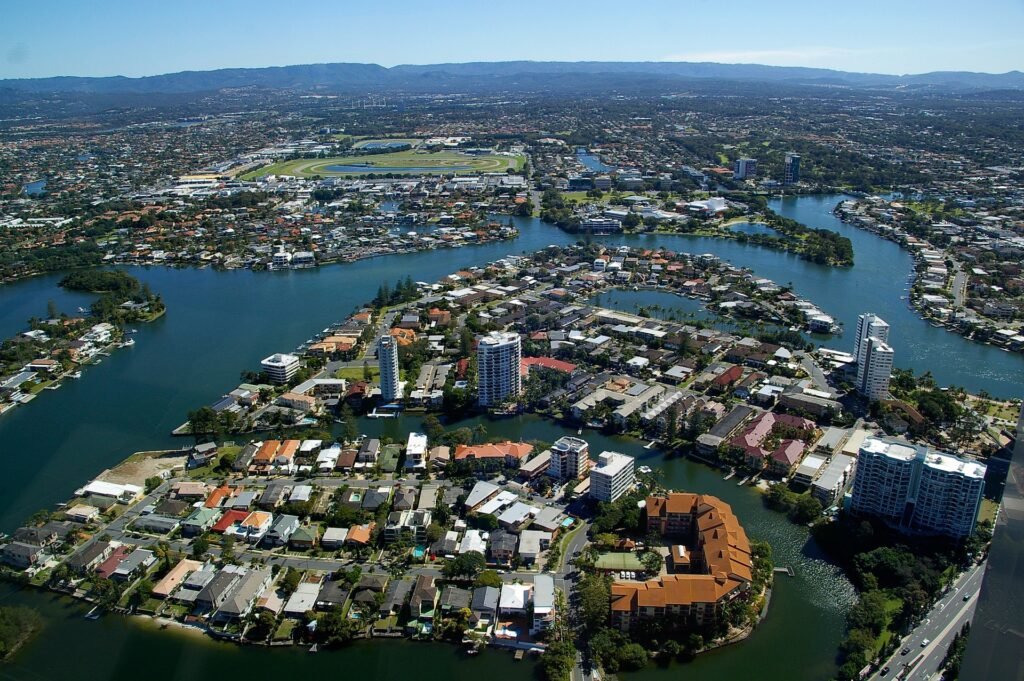
Queensland has experienced the strongest population growth out of all Australian States/Territories from 2016 to 2021 (9.6%), as most LGAs across the state benefited from the large overseas and interstate migration gain that preceded the COVID-19 pandemic. During the pandemic, Queensland continued to benefit from population gains from other states/territories as detailed in our previous blog : COVID-19 – 12 months on: Interstate migration. Highest rates of growth in South-East Queensland are on the outskirts of Brisbane A breakdown of population growth by SA3 (Statistical Area Level 3) allows use to delve deeper into population change beyond the LGA level for South-East Queensland. All SA3 areas…