
Much has been spoken about the changes in development patterns across Australia due to the COVID-19 pandemic. In this article, we analyse dwelling growth in New South Wales and Sydney to discover how development patterns have changed over the last three Census periods. How did we do it? We have allocated all ABS SA2 geographies in Sydney and Regional NSW in 2021 to a series of categories:In Sydney by sector (inner, northern, south-western etc.) and ring (inner, outer etc.)In regional NSW by size of settlement, areas along the coast, areas around Sydney and remaining areasSA2s were allocated for 2016 and 2011 and ABS State Suburbs…
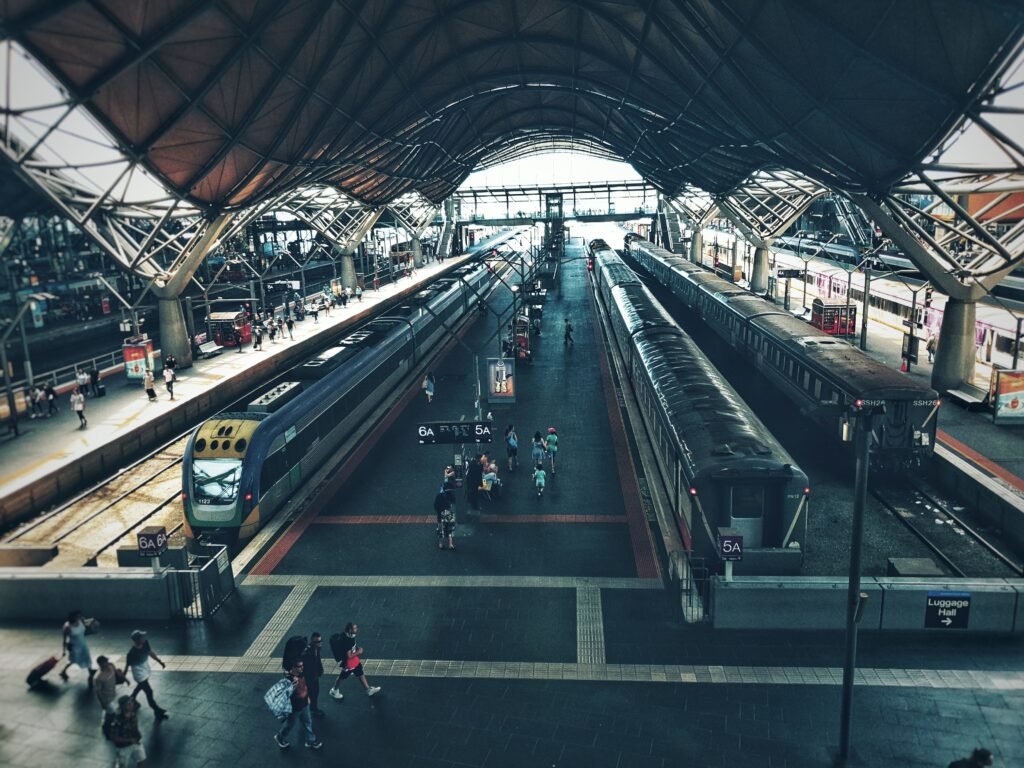
Do you live or work near a PTV train station? Perhaps you drive to one to catch the train? By now, you have probably noticed the amount of residential construction that has taken place around these stations in the last several years – trust us, your eyes do not deceive!Guided by activity centre policies (from both State and local Governments), it aims to focus new residential growth around existing transport nodes, specifically our metropolitan train stations. The idea and practice of encouraging focused higher density development around transit nodes has been around for a while. It brings about many advantages, such as greater walkability, better…

The increasing female participation in the workforce across age groups has been instrumental in reshaping the Australian labour market. While the gender divide in participation rates across industries and employment status is still quite significant, the latest release of the 2021 Census provides us with a more telling snapshot of the emerging patterns and trends of women participation in the labour force and how it has evolved over the years. The share of women in the workforce has been consistently on the rise over the last three decades, with the share of male participation remaining relatively stable. While the gap in participation rate between both…
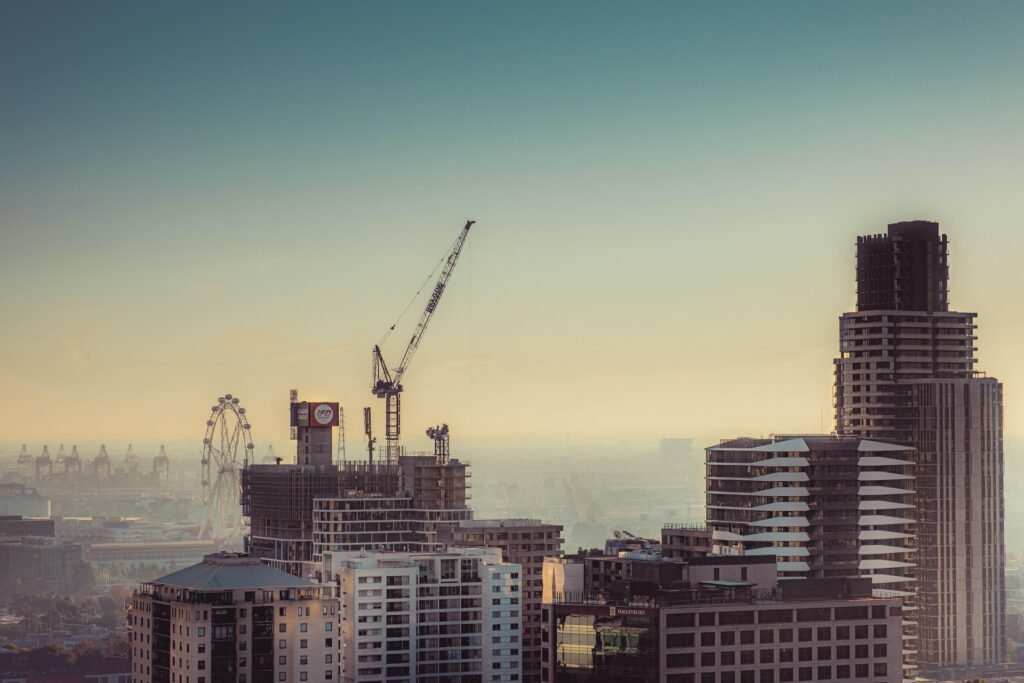
Where has residential development in Melbourne occurred? The beautiful wonderful world of rings and sectors. Much has been spoken about the changes in development patterns across Australia due to the COVID-19 pandemic. In this article, we analyse dwelling growth in Victoria and Melbourne to discover how development patterns have changed over the last three Census periods. How did we do it? We have allocated all ABS SA2 geographies in Melbourne and Regional Victoria in 2021 to a series of categories:In Melbourne by sector (inner, north, west, etc.) and ring (inner, outer, etc.)In regional Victoria by size of settlements, areas along the coast, and other remaining…
The first release of the ABS 2021 Census gave us a fascinating glimpse into to the many structural changes that has taken place within Australia over the last 5 years. Following suit, the second release continued to unravel more interesting trends about the way we’ve adjusted our behaviours and attitudes to the “new normal” in the post COVID-19 and how this is reflected on the wider community and the future of Australia.For those of you who have been following our work (both here and on LinkedIn), you’d know that we have been particularly interested in understanding what the second release reveals about the many employment…

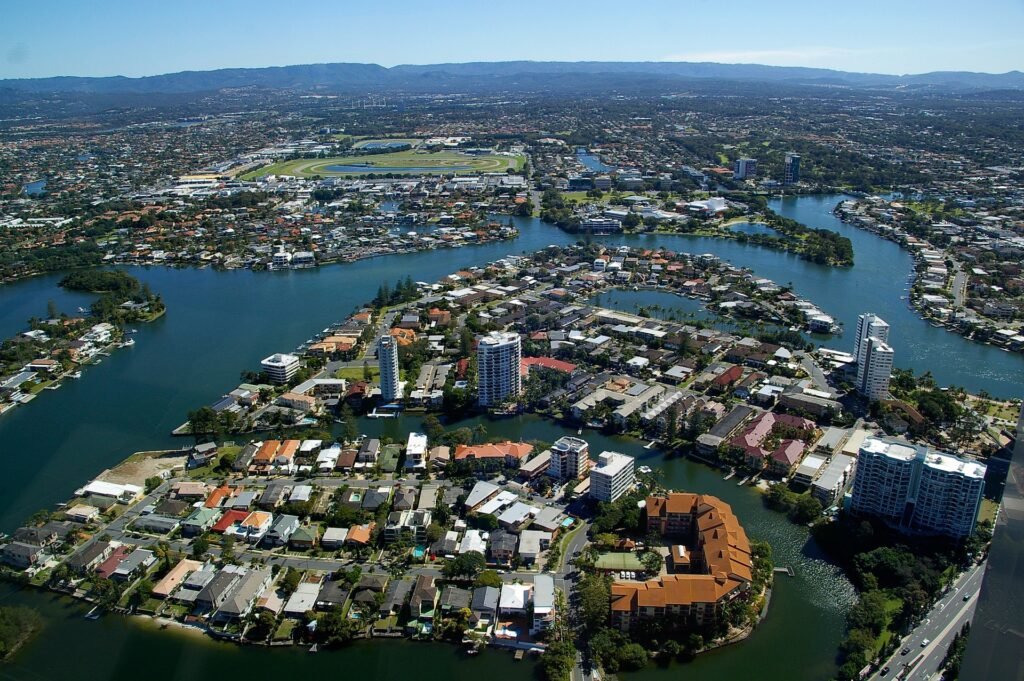
Over 3,000 Melburnians crossed the Yarra River to call Wyndham home The second series release of the ABS 2021 Census has arrived and one of the datasets that we enjoy exploring is the internal migration. This gives us some understanding of the scale of migration and where people are going. If you have been following our Census 2021 blog series so far, we explored the fastest growing Local Government Areas around Australia. In Victoria, this happened to be in the City of Wyndham. During the inter-Censal period, Wyndham went from 217,118 i 2016 to over 292,000 people by 2021 – a gain of nearly 75,000…
The first release of the 2021 Census revealed key insights on the population changes we’ve seen take place within our community since 2016 and the direction in which we’re headed. For the past couple of months, our lead demographers at Demographic Solutions have been extensively covering a variety of topic on our blog page and LinkedIn. With the second release set to be made public on October 12, here’s a quick lowdown on what you need to know before the release. So, what did we learn from the first release? Fringe areas across Australia saw significant gains in population growthA lack of growth in some…
There is constant media attention regarding the state of the housing market in Australia. Are prices going up or are prices going down? Are we meeting housing demand? Are we building too many apartments? Read on to find out more. What Does the 2021 Census Data Tell Us? With the release of the 2021 Census of Population and Housing, we were very keen to see what had happened with indicators of housing supply and demand, namely: Average household size Vacancy rates These two indicators give us a simple, but relatively good feel for the dwelling supply versus demand. At the Australian level, average household size…
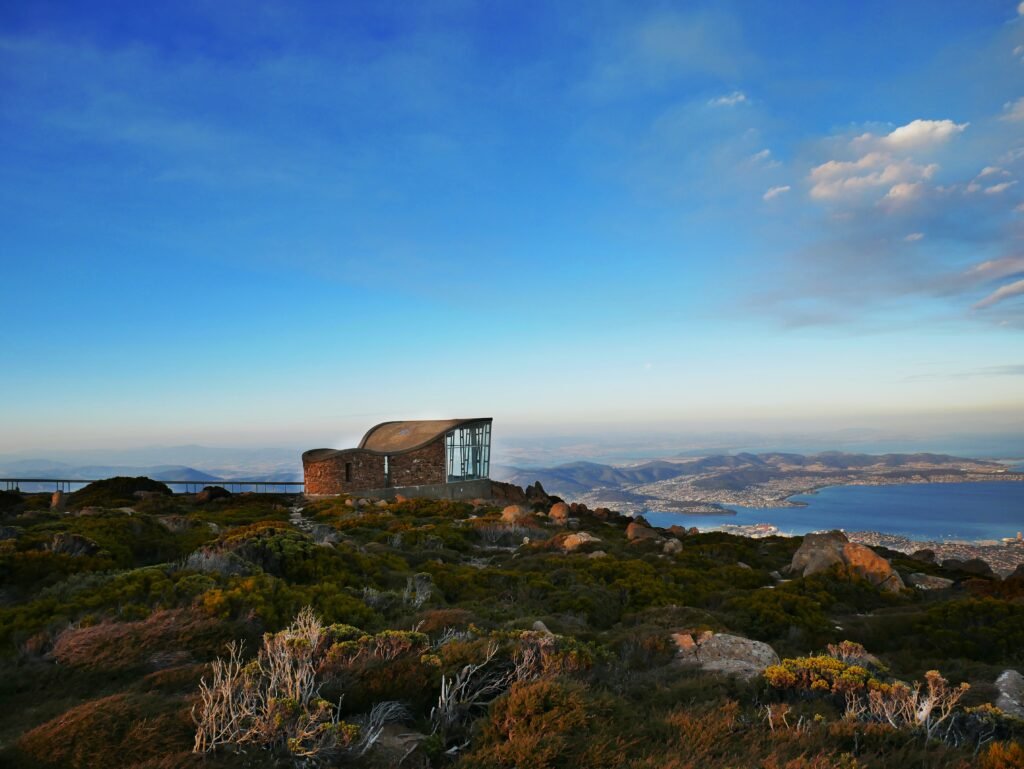
The rate of population growth in Tasmania accelerated rapidly during the 2016-2021 period. The growth rate of 9.3% or 47,610 persons was remarkable after a relatively sluggish previous decade where the State’s population grew by only 33,480. The fastest growing Local Government Areas (LGAs) in Tasmania were a combination of smaller rural LGAs and areas on the edge of Hobart and Launceston. However, the fastest growing LGA in Tasmania between 2016 and 2021 was Central Highlands (17.5%). Almost all LGAs in Tasmania benefited from the large overseas and interstate migration gains to the State that preceded the COVID-19 pandemic. The greatest gains in net terms…
What does the ABS 2021 Census tells us about population growth rates across Southern Australia? Despite the overall rate of population growth in SA experiencing strong gains from 2016 to 2021 (6.3%), not all LGAs across the state benefited from the large overseas migration gain that preceded the COVID-19 pandemic. The fastest growing LGAs between 2016 and 2021 were mainly the outer and fringe areas of Adelaide, where greenfield development was the most predominant. Maralinga Tjarutja Council was the fastest growing Council in remote northern South Australia with a 50%+ increase, although the gain was just 34 persons.Most coastal areas grew strongly in the lead…