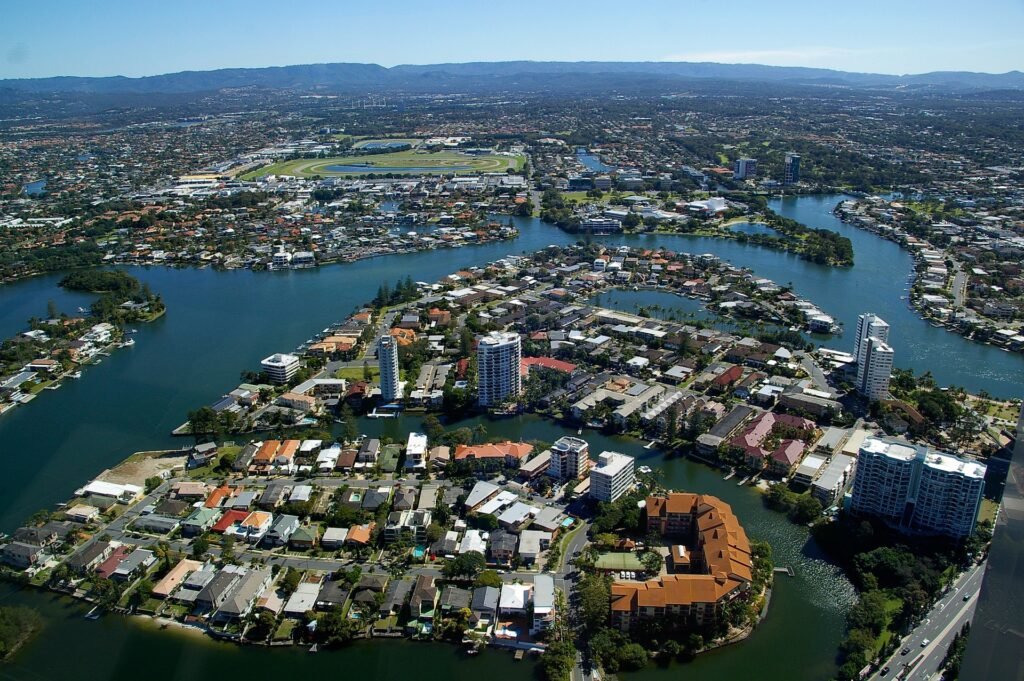
There is constant media attention regarding the state of the housing market in Australia. Are prices going up or are prices going down? Are we meeting housing demand? Are we building too many apartments? Read on to find out more.
What Does the 2021 Census Data Tell Us?
With the release of the 2021 Census of Population and Housing, we were very keen to see what had happened with indicators of housing supply and demand, namely:
- Average household size
- Vacancy rates
These two indicators give us a simple, but relatively good feel for the dwelling supply versus demand. At the Australian level, average household size tends to fall in line with the ageing of the population but can increase in times of housing shortages. Vacancy rates have been falling over time but can increase if there is an oversupply of housing. Surges in overseas migration and changes to fertility behaviour can affect the average household size. As housing has increased in value, the share of dwellings not permanently occupied (holiday homes, business accommodation) has fallen, despite the ready availability of short stay accommodation.
Stepping Back in Time
For a long time, the average household size of Australia has been falling. This is a result of household formation as well as changes to society more generally including lower fertility rates resulting in smaller families, a high rate of divorce and separation for both married and de facto couples, higher levels of income and a higher share of people living alone.
"One for Mum, One for Dad and One for the Country"
The decline in average household size began to slow in the 1990s end the early 2000s began to stabilise. In a throwback to former Treasurer Peter Costello’s famous ringer, the non-means tested “Baby Bonus” scheme was reportedly claimed by more than 720,000 families, aiding the drive in higher population growth rates, without a significant increase in dwelling construction (read also: COVID-19 impacts on Australian Housing). In addition, birth rates increased in the first 10 years of the 21st century, which resulted in a slowing down of the falling share of dependent children in the population.
In the aftermath of the Global Financial Crisis, there was a significant slowdown in residential building construction. This was due to general nervousness about the stability of the Australian housing sector and difficulty in sourcing money for home loans in international money markets. This was hardly surprising, given the calamities occurring overseas such as the collapse of Lehman brothers and the vast problems in the sub-prime mortgage market.
As it turned out, the Australian housing market proved to be extremely resilient and population growth was extremely high, driven by high rates of overseas migration. This led to an imbalance in population growth versus housing construction, a process that has continued up until recent times.
A Growing Desire for Sea/Tree Change
Over the period from 1996 and onwards, there has generally been a fall in the vacancy rate across Australia. This is in parts due to higher demand in regional areas, an increasing number of retirees moving from city to country, converting holiday homes to permanent homes, as well as the potential for undersupply of housing.
So what of the period between 2016 and 2021? We expected that average household size would decline due to the continuation of residential construction during the pandemic and little or no population growth due to the border closures and the departure of many temporary visa holders. This has proven to be the case, but interestingly, the vacancy rate has fallen, which is somewhat counter-intuitive (see chart below).
Average Household Size and Vacancy Rates, Australia, 1996-2021
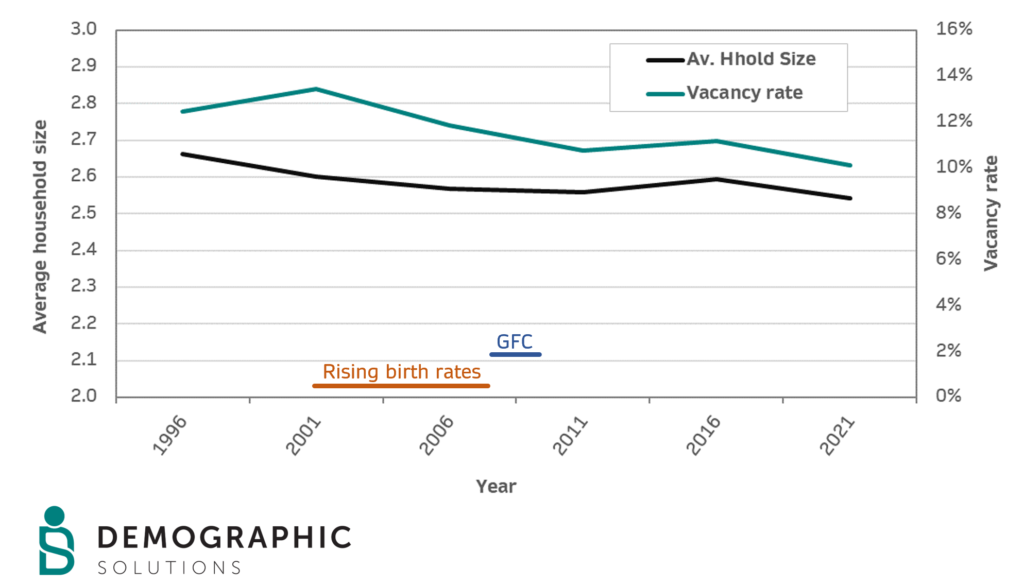
Source: ABS Census of Population and Housing, 1996-2021
Some explanation for this pattern can be derived when looking at regional and metropolitan Australia, in addition to looking at the larger housing markets in Australia. While the average household size of regional areas fell between 2016 and 2021, the fall was considerably lower than the metropolitan areas.
This is likely to reflect several factors:
- Regional areas already have lower average household size (it cannot fall forever)
- More families left metropolitan areas for regional areas during this period, helping to maintain the household size.
- Despite price increases, dwelling construction may have outpaced population growth more readily in metropolitan areas, allowing greater choice.
- More of the dwellings being built in the large cities are smaller apartments.
The largest falls in average household size were in Sydney, Brisbane, Perth and Melbourne. See table below. Interestingly, Adelaide and the ACT had minimal falls in average household size while Hobart actually increased over the period. The increase in Hobart is strongly connected to the high amount of overseas migration during the period (Read Also: Population Growth in Tasmania : Stories from the 2021 Census). It is possible that these markets were under-supplied for housing in the period to 2021.
Average household size, Metropolitan and regional areas, 2016-2021
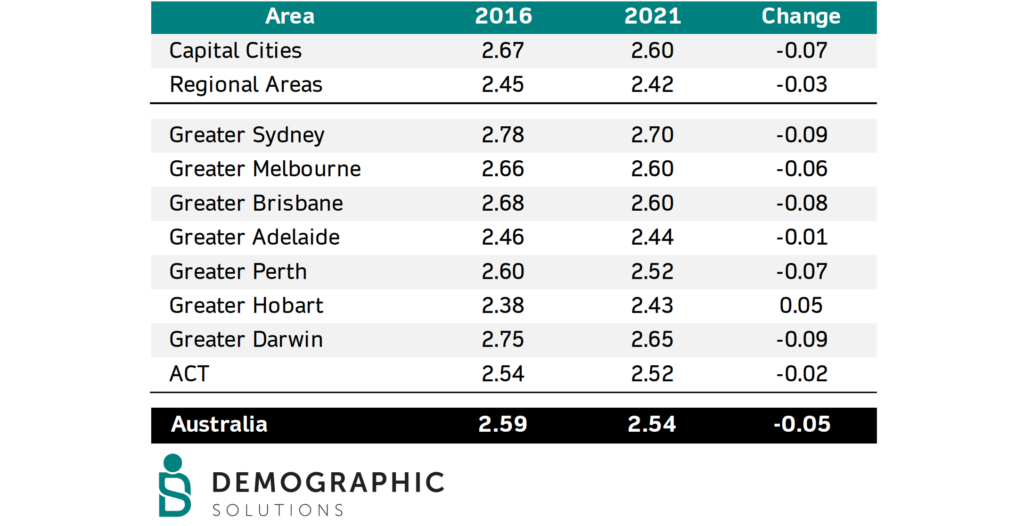
Source: ABS Census of Population and Housing, 2016-2021
The changes to vacancy rates reiterate the changing demand over this period, with a strong decrease in the share of vacant dwellings in regional areas, compared to metropolitan. This is certainly consistent with much of the media attention drawn to regional areas during 2020 and 2021 during the pandemic, rife with claims of city folk moving in, driving up prices and creating a lack of affordable rental housing.
By contrast, however, the vacancy rate actually increased in Sydney and Melbourne, suggesting that there was no lack of supply in the major cities in 2021. This was in complete contrast to the trends occurring in the other metropolitan areas, especially Perth and Hobart. See table below.
Vacancy rates, Metropolitan and regional areas, 2016-2021
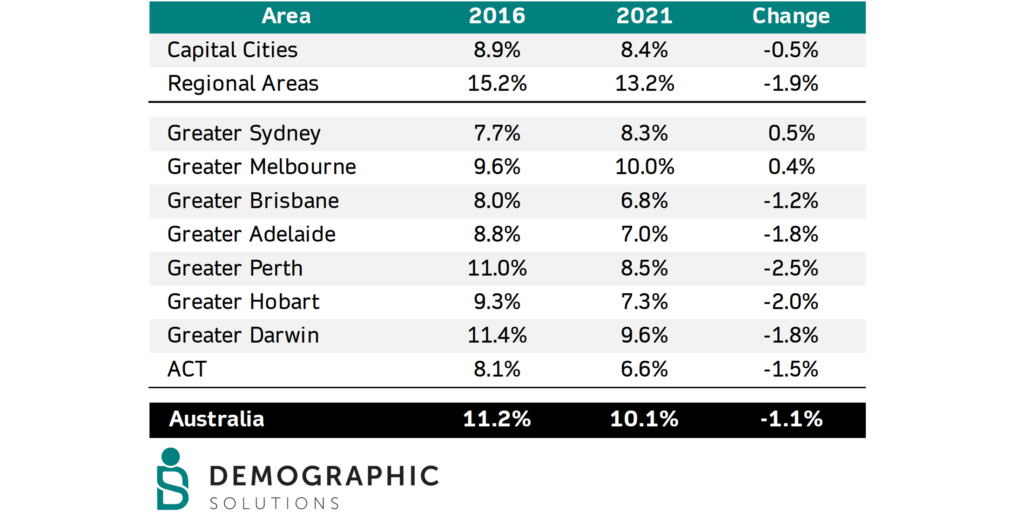
Source: ABS Census of Population and Housing, 2016-2021
Of course, what is unclear is whether this is a short term trend related to the COVID-19 pandemic or whether it is a trend that we can expect to 2026. With rising interest rates and pressure on household budgets, it is possible that average household size will increase again, as people are forced to consolidate their households to make ends meet.