The first release of the ABS 2021 Census gave us a fascinating glimpse into to the many structural changes that has taken place within Australia over the last 5 years. Following suit, the second release continued to unravel more interesting trends about the way we’ve adjusted our behaviours and attitudes to the “new normal” in the post COVID-19 and how this is reflected on the wider community and the future of Australia.
For those of you who have been following our work (both here and on LinkedIn), you’d know that we have been particularly interested in understanding what the second release reveals about the many employment trends that have come to the forefront over the last inter-Censal period.
A quick recap:
The first release shed light on the huge boom in employment rates in this Census period.
- Job creation saw a striking 200% increase as a record 1.3 million jobs were created between 2016 and 2021 compared to the 600,000 jobs created in the previous Census.
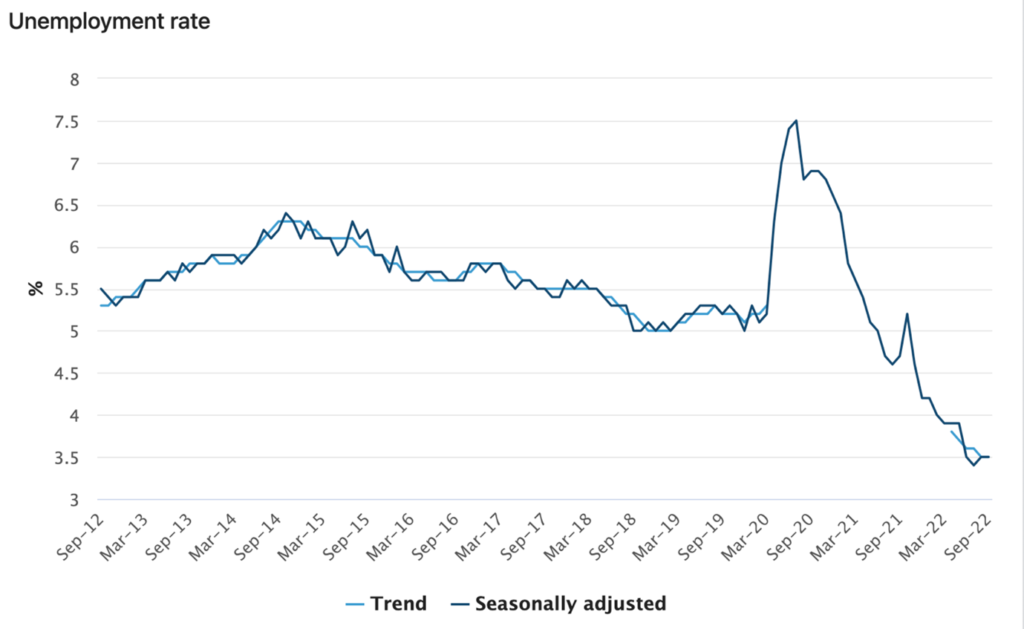
- While unemployment rates saw a temporary rise in the wake of Australia’s pandemic induced border closures and economic uncertainties, the economy remained resilient with employment rates quickly recovering to almost pre-COVID levels.
- Since the Census in August 2021, unemployment rates are estimated to have continued to fall (see Chart below)

Source: Australian Bureau of Statistics, Labour Force Australia 2021
In light of the drop in unemployment rates, especially in comparison to the last decade, the second release data on employment status and hours worked is key to understanding what has driven these changes.
Key Takeaways:
Huge increase in employment between 2016-2021
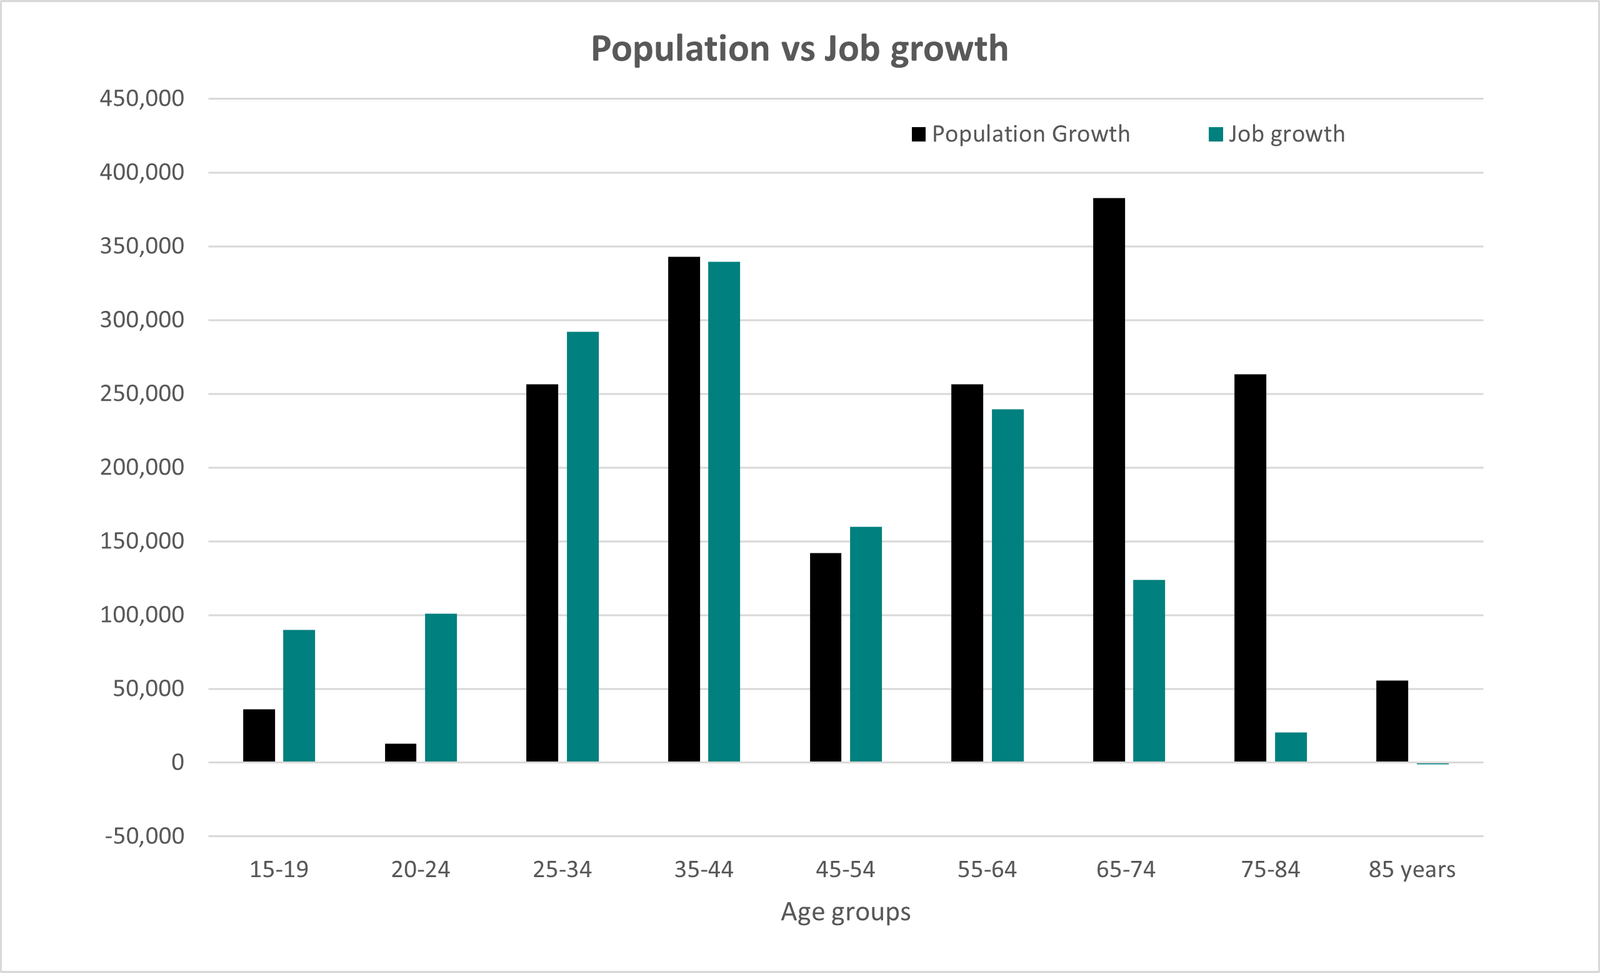
- A significant increase in employment across all age groups (15-79 years) was noticed – except for individuals aged 80 and above. This fall is likely to relate to concern about risks of COVID exposure in the workforce.
- The growth in employed individuals among the 25 to 64 year olds more or less mirrored the growth in population witnessed among these age brackets.
- The gains made in those aged 15-24 entering the labour force has been significantly greater than the population increase seen within this bracket.
- Unsurprisingly, the bulk of employed individuals under 25 are involved in part-time employment. This mirrors the rise we’ve seen in more and more young people taking up part-time jobs in the retail and hospitality sectors.
- See chart below for details

Source: Australian Bureau of Statistics, Census of Population and Housing 2021
More than 65% of the Australian population aged 20-74 are employed
- While this is a promising sign of economic recovery and a healthy labour force participation rate, it is noteworthy that numbers of those continuing to be a part of the labour force do slow with age – especially post 65.
- However, the share of employed individuals over 55 has been on the rise over the years. This could be an
indication of the value that people place on work. Alternatively, it may reflect the increased costs of living, the need to top up superannuation or to pay off the last of their mortgage.
We saw double the net growth in jobs during this period, with some industries losing and others gaining
-
There were employment gains in the primary and secondary industries between 2016 and 2021. This is a huge contrast with the previous period where the manufacturing industry saw a decline of about 219,000 jobs, spearheaded by the demise of the automotive manufacturing industry.
- Wholesale trade was also particularly affected, losing almost 96,000 jobs in this period.
- Healthcare, education, construction and accommodation and food services emerged the biggest winners, roughly accounting for almost three quarters of the job growth.
- Primary industries like mining and agriculture also enjoyed a marginal uptick in jobs when compared to the previous Census period.
Stay tuned to this page as we continue to deep-dive into the second release, uncovering the many interesting trends and factors that are responsible in reshaping the society and how we function within it.

