Queensland has experienced the strongest population growth out of all Australian States/Territories from 2016 to 2021 (9.6%), as most LGAs across the state benefited from the large overseas and interstate migration gain that preceded the COVID-19 pandemic. During the pandemic, Queensland continued to benefit from population gains from other states/territories as detailed in our previous blog : COVID-19 – 12 months on: Interstate migration.
Highest rates of growth in South-East Queensland are on the outskirts of Brisbane
A breakdown of population growth by SA3 (Statistical Area Level 3) allows use to delve deeper into population change beyond the LGA level for South-East Queensland. All SA3 areas in South-East Queensland had population growth, with the fastest rates of gain on the fringe of the Gold Coast, Ipswich and Logan. The growth in these areas was driven by high rates of greenfield residential development in new estates, with Jimboomba (+35.2%), Ormeau-Oxenford (+30.8%) and Springfield-Redback (+25.4%) at the forefront of growth to 2021.
Brisbane Inner (+29.4%) had the highest growth of all of City of Brisbane SA3s, pushed by the substantial residential building activity in Fortitude Valley, South Brisbane and West End, especially between 2016 and 2019 (pre-pandemic). Just to the north of Brisbane City, North Lakes (+23.1%) rounds off the top 5 fastest growing areas in SEQ, thanks to various development fronts during this period, both greenfield and medium density around activity centre.
Top 10 Growth SA3s by rate, Queensland, 2016-2021
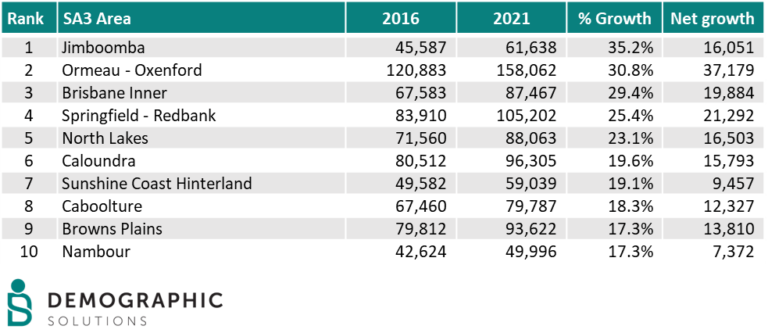
Source: ABS Census of Population and Housing, 2016 and 2021
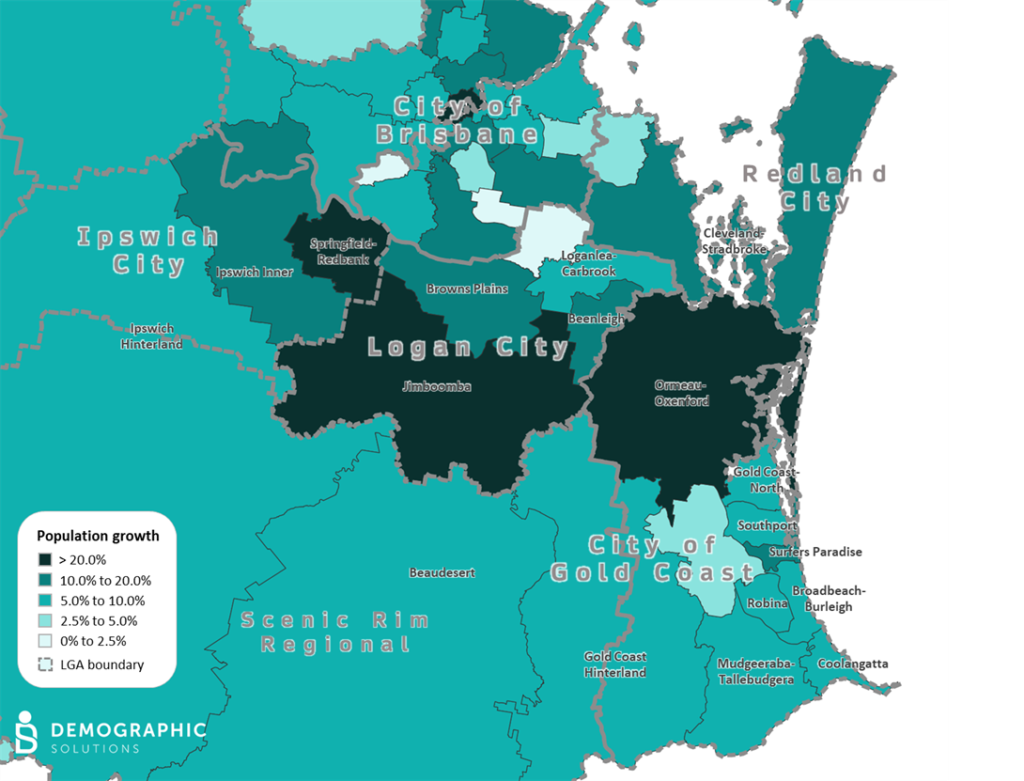
Other notables in the Gold Coast-Ipswich-Logan region:
- All SA3 areas increased in population, with most areas experiencing at least 5% growth between 2016 and 2021.
- Surfers Paradise experienced a 10.7% growth rate with an additional 4,361 people.
- The areas just outside the City of Brisbane with rapid growth included: Beenleigh (+13.2%), Browns Plains (+17.2), Cleveland-Stradbroke (+12.8%) and Ipswich Inner (+11.2%). These areas combined for an increase of nearly 41,500 people between 2016 and 2021.
Population growth: Gold Coast, Ipswich, Logan SA3s, 2016-21
People still love the city!
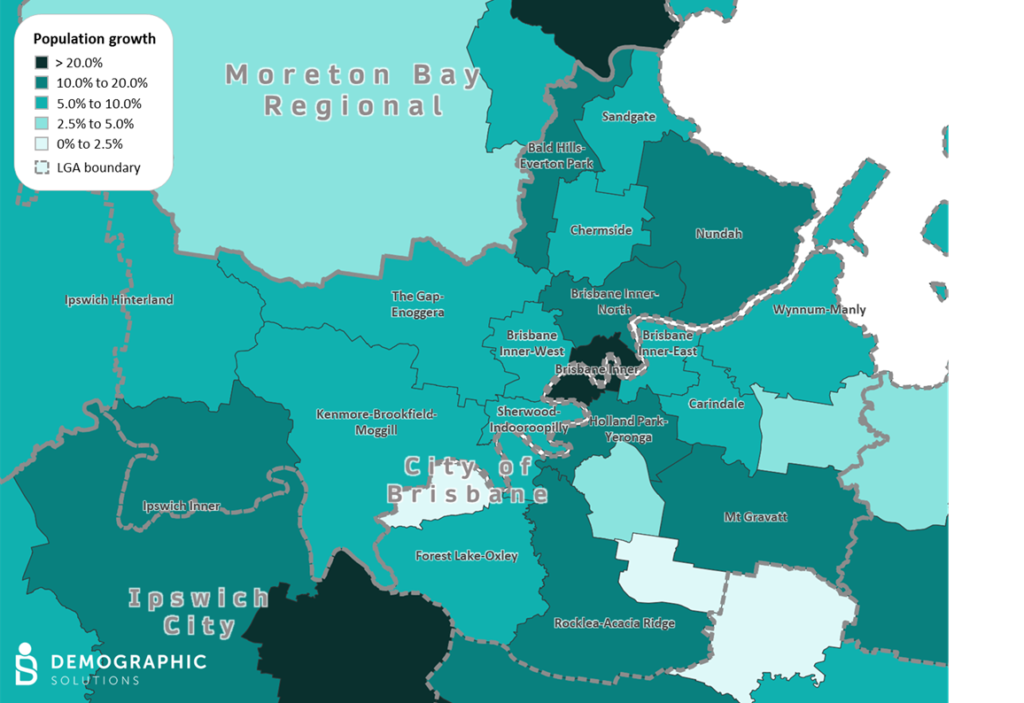
Notable changes in the City of Brisbane region:
- Most areas experienced at least a 5% growth between 2016 and 2021.
- Brisbane Inner – North ranks just outside the top 10 for SEQ with +16.1% growth for an increase of 13,900 people between 2016 and 2021.
- ”North of the river” areas with rapid growth include the outer areas of Bald Hills-Everton Park (+13.1%) and Nundah (+11.1%) due in large part significant greenfield development fronts. Combined, this is an increase of over 9,600 people.
- “South of “the river” growth areas include the established areas of Holland Park-Yeronga (+11.8%) and broad hectare areas on the fringes of Mt Gravatt (+11.5%) and Rocklea-Acacia Ridge (+14.0%).
Population growth, City of Brisbane SA3s, 2016-21
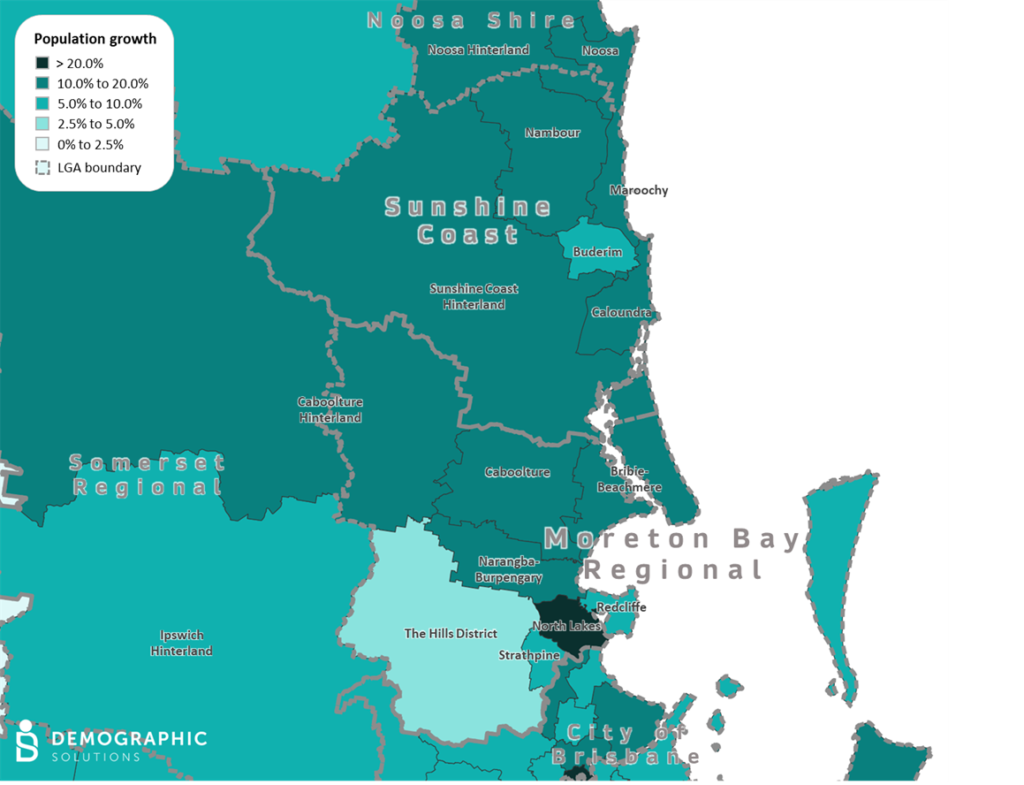
Moreton Bay and Sunshine Coast grows by nearly 100,000 people
The coastal regions of Moreton Bay and Sunshine Coast continues to play a vital role as a place for retirees and those seeking other lifestyle options, whilst retaining access to the Brisbane CBD. Broadly speaking, between 2016 and 2021, Moreton Bay LGA and Sunshine Coast LGA gained the greatest number of people after the City Brisbane and the City of Gold Coast. Moreton Bay LGA had a growth rate of +12.0% with an increase of 51,000 people (think Suncorp Stadium!) while Sunshine Coast experienced a +16.4% growth rate (or 48,000 people).
Other notables in the Moreton Bay-Sunshine Coast region:
- North Lakes SA3 had the fastest growth in this region (+23.1%)
- All coastal SA3s between North Lakes and Noosa experienced more than 10% in growth between 2016 and 2021.
- Four of the top 10 fastest growth SA3s in SEQ are in this region: Caloundra (+19.6%), Sunshine Coast Hinterland (+19.1%), Caboolture (+18.1%) and Nambour (+17.3%). Combined, this is an increase of nearly 45,000 people between 2016 and 2021.
Population growth, Moreton Bay and Sunshine Coast SA3s, 2016-21
Diverse population change in regional areas
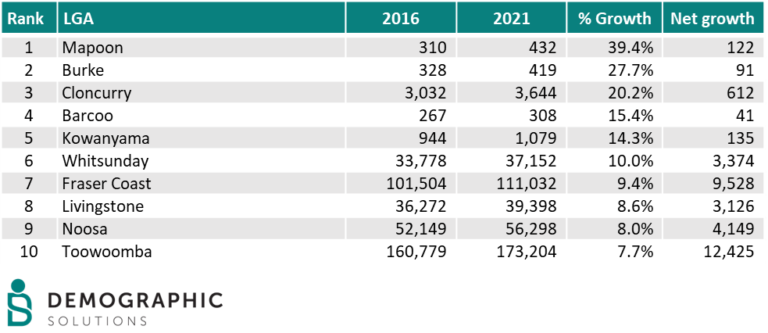
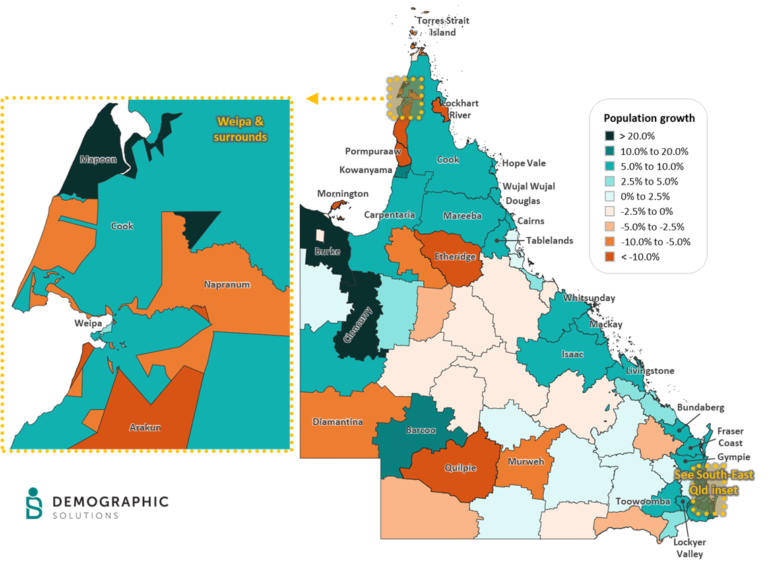
Most of the top 5 fastest growing LGAs in Regional Queensland were those with small population bases at 2016 (under 1,000 persons). Similarly, areas with large percentage decreases tend to be small, remote LGAs. It is most likely that these changes are driven by with the rise and fall of mining in these areas. However, there are also significant indigenous communities in many of these smaller regional LGAs and the impact of transient populations may also be a factor.
Whitsunday, Fraser Coast, Livingston and Noosa have historically played its role as popular retirement and lifestyle areas. As such, these areas experienced significant rates of growth as well gains in the number of persons. See table below for reference.
Top 10 Regional LGAs by rate, Qld, 2016-2021
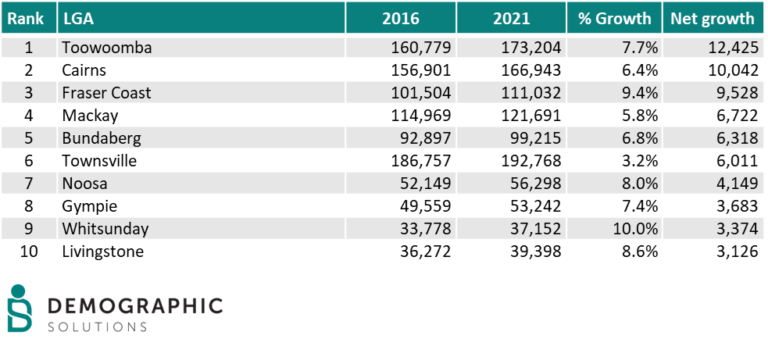
In terms of the bulk of net population growth in regional Queensland, the coastal strip north of Brisbane to Cairns has the greatest gains. However, in terms of net growth, Toowoomba had greatest gain of all Regional LGAs (+12,400 persons or +7.7%). The city attracts people from all over with its lifestyle options, solid economic base and affordable housing stock.
The major coastal centres of Cairns, Mackay, Bundaberg and Townville also experienced solid rates of growth and net gains of over 5,000+ people between 2016 and 2021. See table below for reference.
Top 10 Regional LGAs by net growth, Qld, 2016-2021
Regional LGAs that saw large rates of decline between 2016 and 2021 were the Gulf areas of Pormpuraaw, Palm Island, Aurukun and Mornington, as well as the inland LGAs of Quilpie and Etheridge. These areas are home to remote Indigenous communities that are often transient and there may be some connection between decreases in these areas and the population gains in Burke, Mapoon and Cloncurry. The increases in Cloncurry may also be mining-related, with significant gold and copper mines in the area.
Population growth, Queensland LGAs, 2016-21
Key Takeaways...
- Queensland continues to see the strongest growth of all the states/territories in Australia.
- Historical trend of Queensland attracting people from southern states continues.
- The Queensland coastal areas continue to attract persons, with the Gold Coast, Sunshine Coast, Whitsunday, Fraser Coast, Livingstone and Noosa growing rapidly.
- Toowoomba continues to grow: It ranks in the top 10 LGAs with a rate of +7.7% and has the highest number of persons gained (+12,425) of all regional LGAs.
- Albeit smaller population bases in 2016, the growth rates in the LGAs of Mapoon, Burke, Cloncurry, Barcoo and Kowanyama rank in the top 5. Interestingly, these growth LGAs are located near those that have experienced the most rapid rates of declines. Some of these LGAs are likely to be affected by movement of indigenous population and change in the mining industry.
- SEQ sees accelerated growth between 2016 and 2021. The top 5 SA3 experience +20.0% growth or more with Jimboomba (+35.2%) and Ormeau-Oxenford (+30.8%) leading the way.
- Brisbane Inner continues to attract persons, based on high rates of apartment construction (ranks third for all SA3s).
- Moreton Bay (+51,000) and Sunshine Coast (+48,000) have enough population growth to fill Suncorp Stadium twice!
Stay tuned for more stories from the 2021 Census and our quick fire series on LinkedIn.