The result of the 2023 Referendum on Indigenous Recognition and the Voice to Parliament was a disappointing outcome for the ‘Yes’ campaign and I feel that disappointment too.
While the overall result seemed never to be in doubt, the pattern of voting across Australia is highly revealing about the nature of people’s views about progressive social issues. It may also reflect the inherent conservative nature of the Australian electorate when it comes to change and the level of priority that Australians have towards the nation’s first peoples.
The blurring of traditionally labour areas into the ‘No’ camp and liberal areas into the ‘Yes’ camp is obvious from the results and indicates many voters did not ‘tow the party line’. By contrast, rural areas were overwhelmingly against Indigenous Recognition and the Voice to Parliament, while areas with large shares of Green voters were highly supportive of the ‘Yes’ camp.
The national map indicates the prevalence of the ‘No’ vote in most of rural and remote Australia. Surprisingly, even the seat of Lingiari which covers large inland areas and has an indigenous population of about 40% was still unable to register a majority ‘Yes’ vote. At the national level, the only electoral divisions that are noticeably in the ‘Yes’ column are Franklin in Tasmania (which covers part of Hobart) and Bean in the ACT. The margin in Franklin is relatively low and may yet fall into the ‘No’ column. See below.
Share of ‘Yes’ vote by Electoral Division, 2023 Voice Referendum
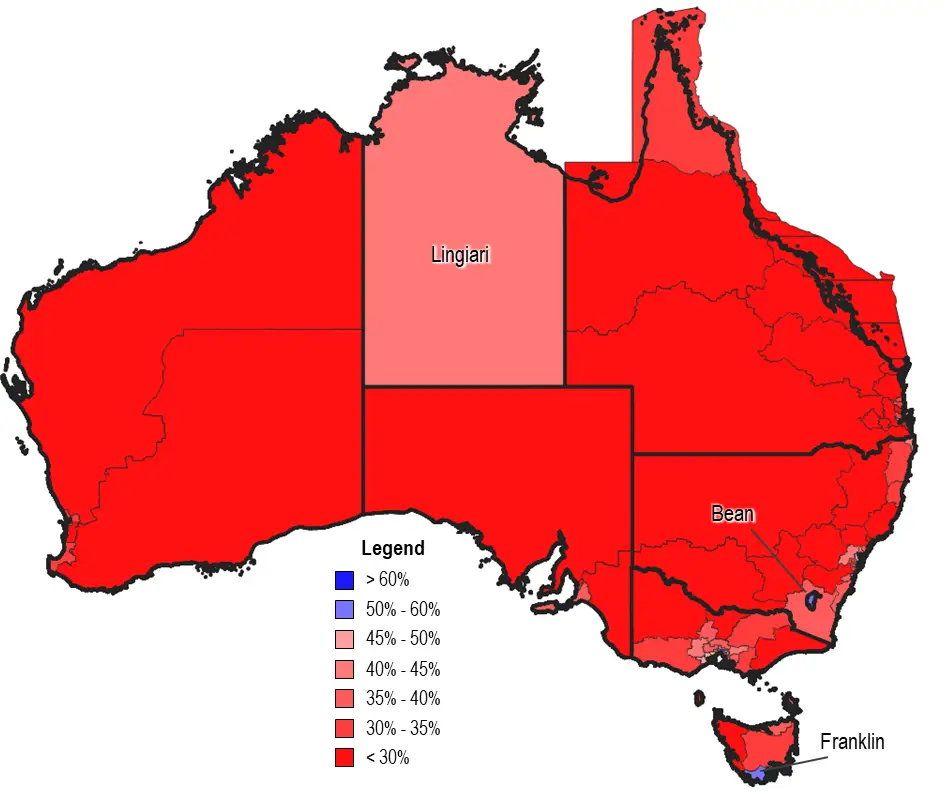
Source: AEC, 2023 Referendum Tally Room (as counted on 16/10/23)
There has been some commentary on the voting patterns, referencing education levels and general socio-economic differences. This is clearly the case across metropolitan areas, but factors such as distance from the CBD, the share of persons under 40, as well as wealth and income also seem to have been major factors.
Of the 42 seats that are comprised of either rural areas and small towns or regional centres and rural areas, only Ballarat in Victoria and Lingiari in the NT had more than 40% voting ‘Yes’. Of these 42 electoral divisions, 33 electorates had more than two-thirds of their populations voting ‘No’. This pattern seems to go well beyond general issues of socio-economic status. It may be that policies that are seen to benefit Aboriginal and Torres Strait Islanders are deemed as a much greater threat to the general population in rural and regional areas. However, the largest non-capital cities in Australia, Newcastle and Wollongong (seat of Cunningham) actually had a majority of ‘Yes’ voters.
Most metropolitan areas had some electoral divisions with a majority ‘Yes’ vote. The largest number was in Melbourne, although all three seats in the ACT voted in favour of the proposal. Sydney had 8 divisions with a majority of ‘Yes’, with the Prime Minister’s seat having almost three quarters of the population agree with the proposed constitutional change. See below.
Share of ‘Yes’ vote by Electoral Division, Sydney and Surrounds, 2023 Voice Referendum
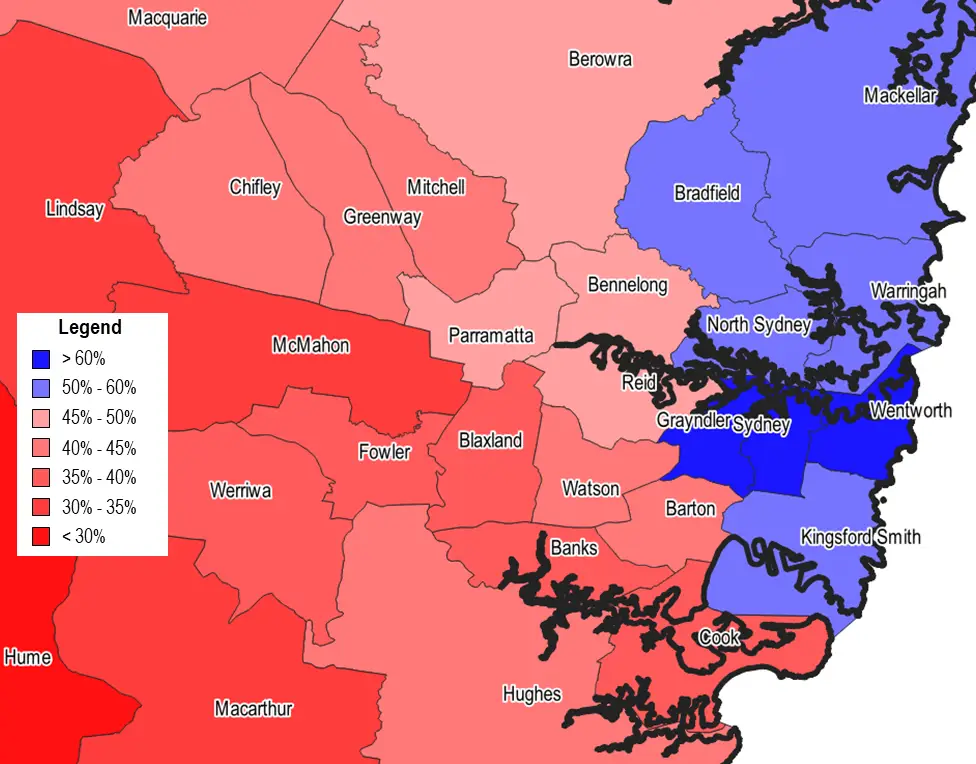
Source: AEC, 2023 Referendum Tally Room (as counted on 16/10/23)
Traditionally, majority Liberal voting areas on the North Shore voted in favour of the referendum while middle and outer suburban areas, many of which are currently held by Labour members voted ‘No’, sometimes definitively so. The seat of McMahon, currently held by high profile minister Chris Bowen, was won at the 2022 election with almost 60% of the two-party preferred vote. However, only 35% of the population voted ‘Yes’.
The share of ‘middle-suburban areas voting ‘Yes’ was much higher in Melbourne. Areas in the eastern suburbs traditionally associated with the Liberal Party (in some cases now Teal seats) had a significant ‘Yes’ vote including Goldstein, Higgins, Kooyong, while Hotham, Chisholm and Deakin were about 49% in the ‘Yes’ camp. Overall, the share of ‘Yes’ voters was again lower on the fringe of the city and in regional areas. See below.
Share of ‘Yes’ vote by Electoral Division, Melbourne and Surrounds, 2023 Voice Referendum
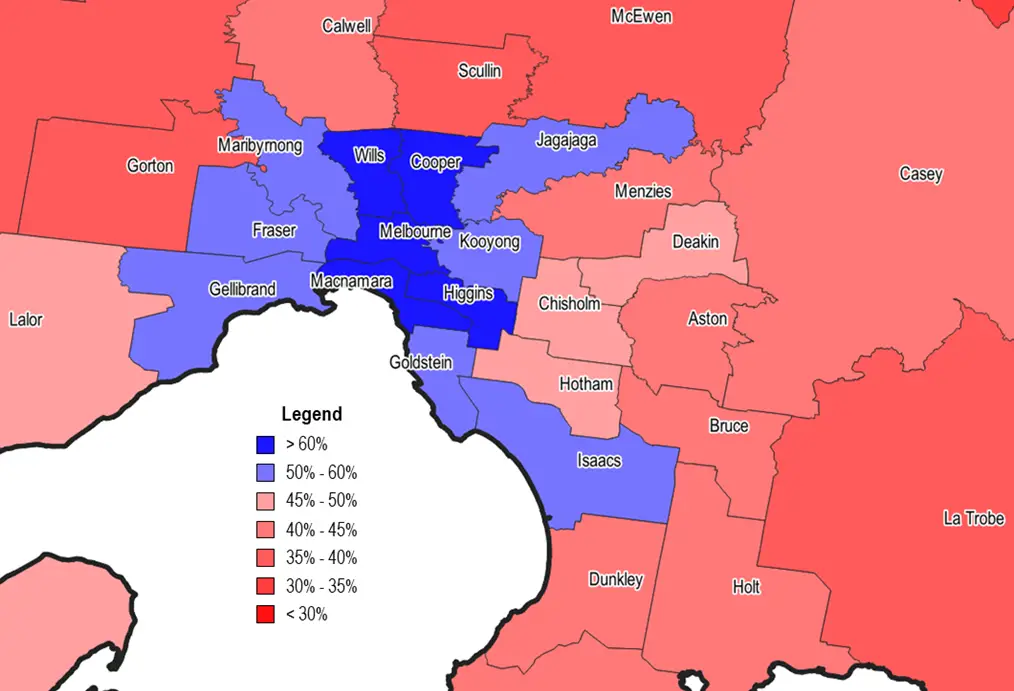
Source: AEC, 2023 Referendum Tally Room (as counted on 16/10/23)
The overall share of the ‘Yes’ vote in Queensland was very low, but like Sydney and Melbourne, the inner and middle suburban areas of Brisbane had a higher share. The electoral divisions where the population affirmed the referendum were all seats where the Green vote is at its highest. See below.
Share of ‘Yes’ vote by Electoral Division, Brisbane and Surrounds, 2023 Voice Referendum
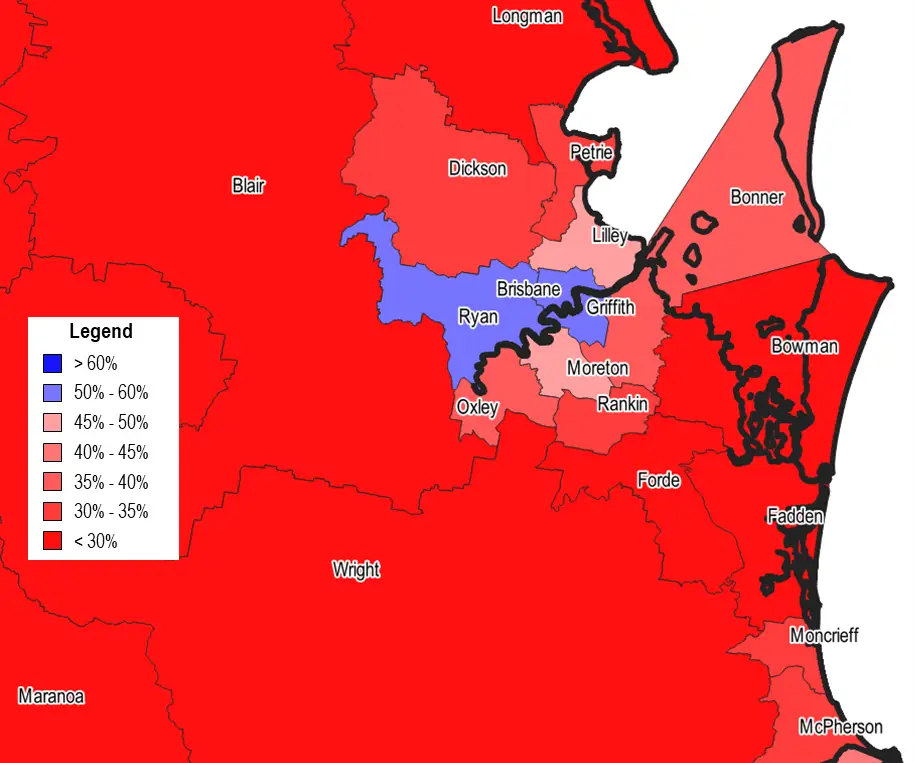
Source: AEC, 2023 Referendum Tally Room (as counted on 16/10/23)
Only the electoral divisions of Perth and Curtin experienced a majority of voters favouring the Aboriginal and Torres Strait Islander voice in WA. While the share of ‘Yes’ voters was very low (less than 30%) in most seats beyond the inner city. See below.
Share of ‘Yes’ vote by Electoral Division, Perth and Surrounds, 2023 Voice Referendum
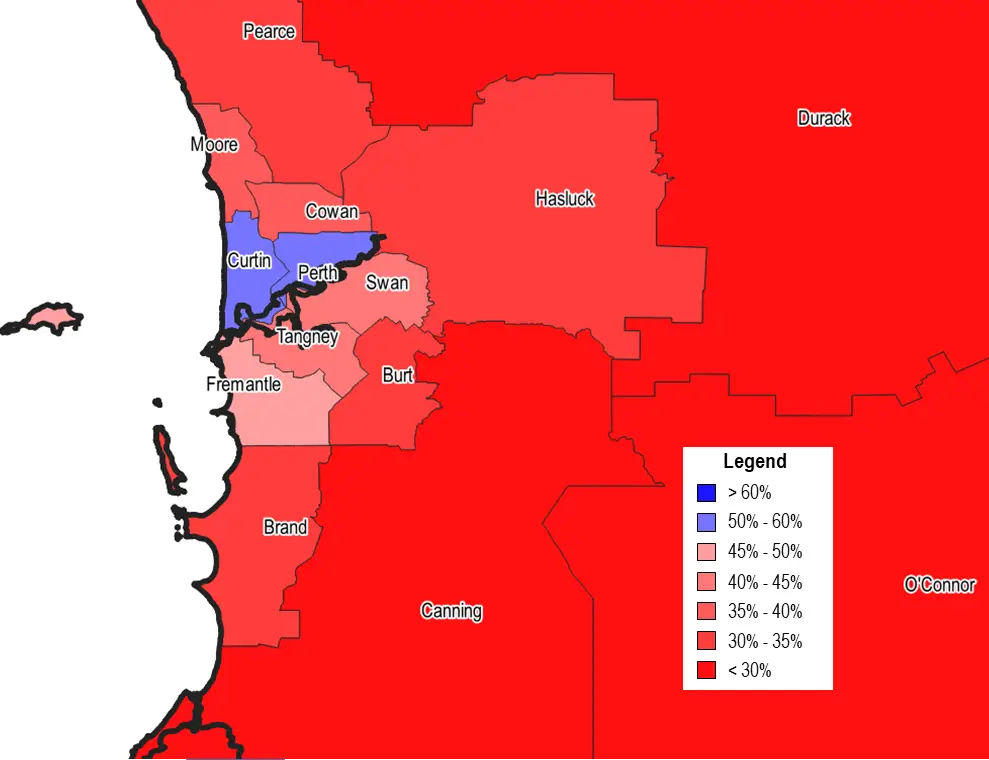
Source: AEC, 2023 Referendum Tally Room (as counted on 16/10/23)
Notably, no electoral divisions in South Australia had a majority of ‘Yes’ voters, with only Adelaide and Boothby coming close to affirming the referendum (approximately 48%).
So why ‘No’ in areas where the Government has majority support? Why ‘Yes’ in the traditionally wealthier Liberal suburbs? For many in the ‘No’ camp, this referendum was indicative of a Government and inner-city elite that is out of touch with ordinary Australians who are suffering from greater financial pressure through higher housing costs and general cost of living concerns. For some, there was a feeling the Voice would not be a practical measure to improve the lives of indigenous people. For others, there was simply not enough information to explain how the Voice would work. However, I suspect that many feared that a greater role for first nations’ peoples in decision-making was a threat to them.
In the end, we will never know if the Voice would have made a difference. Let’s hope those who voted ‘No’ will genuinely support legislative attempts to ‘close the gap’.