
The increasing female participation in the workforce across age groups has been instrumental in reshaping the Australian labour market. While the gender divide in participation rates across industries and employment status is still quite significant, the latest release of the 2021 Census provides us with a more telling snapshot of the emerging patterns and trends of women participation in the labour force and how it has evolved over the years.
The share of women in the workforce has been consistently on the rise over the last three decades, with the share of male participation remaining relatively stable. While the gap in participation rate between both the genders has been steadily declining, the minor fall over the previous two Census periods in male participation may also relate to a higher share of population in aged over 60 (the ageing of the population). See Chart below.
A changing trajectory of female participation in the workforce
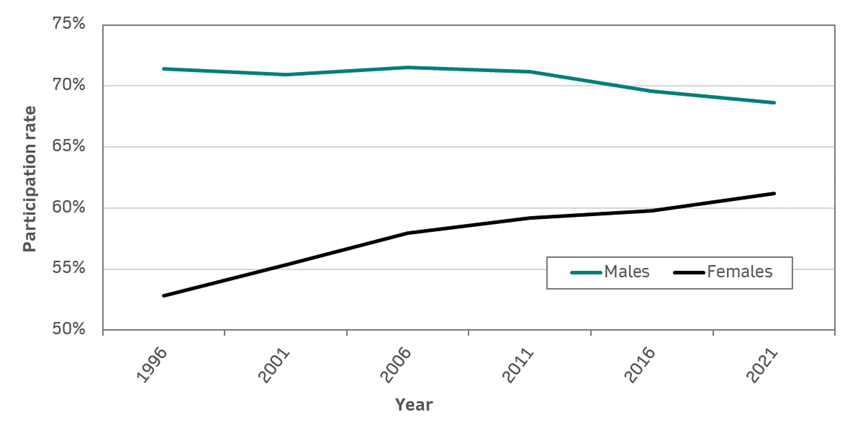
Source: Australian Bureau of Statistics, Census of Population and Housing 2021
In order to understand how female workforce participation rates have changed over the decades, we conducted a further deep-dive by looking into participation rates across different age groups and how the trend has changed among different generations with time.
Historically, women’s participation tended to start at higher levels in the 15-24 age bracket, ebbing towards the 25-34 age group with most women either leaving or taking a break from the workforce to have families. The numbers gradually declined as the population aged, with retirement more common with women entering their mid-50s. See Chart below.
Female workforce participation by age 1996-2021
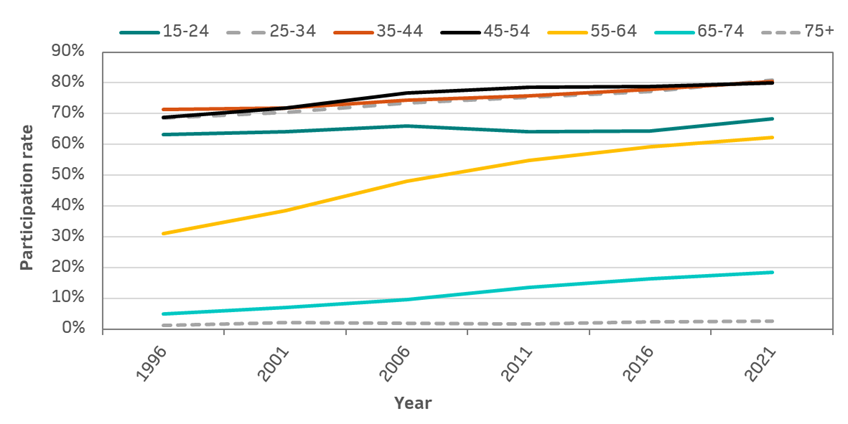
Source: Australian Bureau of Statistics, Census of Population and Housing 2021
Off late, the trend of women in their late 20s to early 40s taking a work hiatus has dropped significantly, presumably driven by higher education rates and decreasing fertility rates and household sizes. An increasing number of women opt for part-time working options that give them the flexibility to balance both their domestic and professional responsibilities, especially after starting families.
This can also be attributed to the rise of the professionalisation of traditionally domestic, unpaid work like childcare and domestic cleaning. Another driving force behind the trend is the shift in attitudes towards work-life balance and the need for a more flexible work culture.
This reflects in the number of women that continue to stay in the workforce for longer periods of time when compared to previous Censuses. According to the latest release, the largest increase in the participation rate was in women aged 55-64, where the share of population engaged in work or seeking work doubled from 1996 to 2021.
In our last blog on this topic, we also discussed how the second release of the Census revealed massive job creation growth in industries like health care, education and personal services. These sectors are traditionally more female-dominated industries and could also be a factor in the strengthening of female workforce participation women this inter-Censal period.
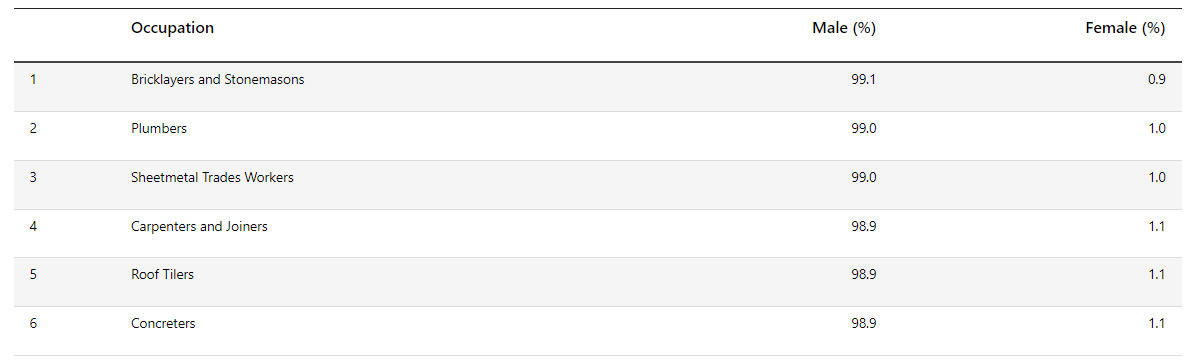
The most male jobs vs the most female jobs: Increasing female representation across the board
Most male-dominated occupations in 2021
Most female-dominated occupations in 2021

Source: Australian Bureau of Statistics, Census of Population and Housing 2021
Typically female-dominated industries like healthcare and social assistance, and education and training continue to see an increasing proportion of women taking up jobs in these fields, in parallel to the higher creation of jobs in these sectors as observed in the second release.
Interestingly, male-dominated industries, namely construction also saw an increase in female representation. While only 1 per cent of women work in these professions, females with qualifications related to Building Construction Management has doubled since the last inter-Censal period. This also reflected in the increasing number of women taking up management roles within the construction industry, roughly accounting for almost 10% of these jobs in the country.
Jobs that saw the biggest increase in female representation from 2011 to 2021:
- Community and Personal Service Workers (+168%)
- Storepersons (+90%)
- Chief Executives, General Managers and Legislators (+88.6%)
- ICT professionals (+75.5%)
- Managers (+73.8%)
More women hold higher educational qualifications than men, but they still continue to be underrepresented in senior-level positions across industries
Non-school qualifications at bachelor degree level and above
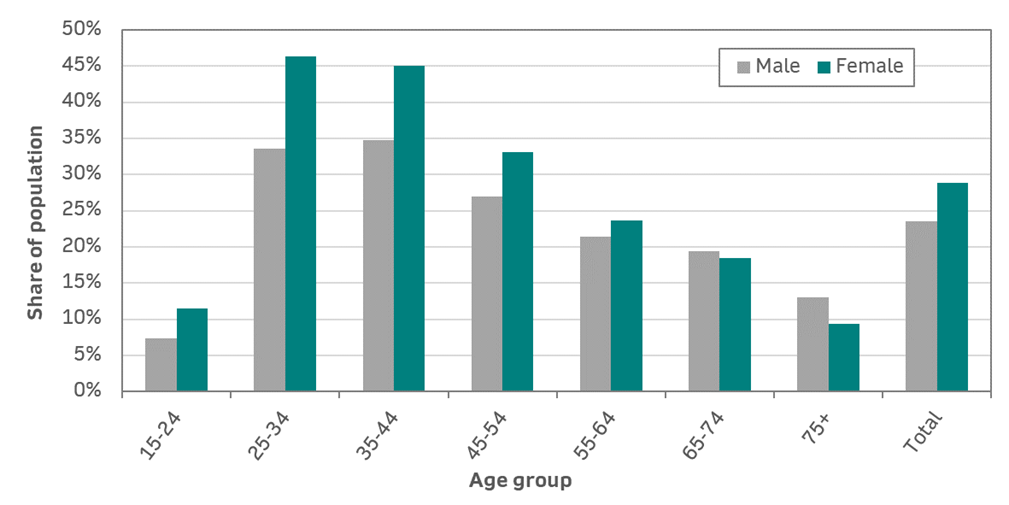
Source: Australian Bureau of Statistics, Census of Population and Housing 2021
The share of women attaining non-school qualifications, in particular bachelor degrees or above, surpassed the share of men with similar qualifications across all age groups under 65. While the gap in the proportion of women and men having attained university qualifications and above decreases with age, female university graduates from 25-34 accounted for over 50% in comparison to the 38% of their male counterparts with similar qualifications. This is a very encouraging sign for the labour market as we continue to see a strong wave of young women entering the workforce as qualified and competent employees.
However, this still fails to translate to women holding senior-level, executive positions, both within corporate and public sectors in the country. This pattern will undoubtedly change, as more experienced, well-qualified women reach positions of power.

Source: Australian Bureau of Statistics, Census of Population and Housing 2021
According to the latest employment data, while 71% of Australian men hold executive, senior management roles, only 29% of women were reported to be in similar positions. While there has been a consistent increase in the share of women taking on senior-level management roles – as we discussed before – the shocking disproportion between both men and women in these positions still remains food for thought. The disparity continues to reflect in the pay gap across industries as well.
Share of workers earning in the top quartile income

Source: Australian Bureau of Statistics, Census of Population and Housing 2021
The industries with the highest pay gap between men and women include:
- Mining
- Professional, scientific and technical services
- Health care & Social assistance
- Financial and Insurance services
This makes for an interesting pattern. While it is understandable for the pay gap to be so severe in industries like mining which is so significantly male-dominated, it seems to be a recurring trend even in typically female-dominated industries like health care and social assistance. The increase in female participation across industries has driven a gradual overall decrease in the pay gap, however, it is still worth considering the structural and occupational barriers that women continue to face in the labour force that enables the prevalent disparity in positions held and pay between both genders.